
measure extends tidymodels with preprocessing steps for analytical measurement data such as spectroscopy, chromatography, and other instrument-generated signals. It provides a recipes-style interface for common spectral preprocessing techniques.
Use recipes to convert long or wide measurements, preprocess each signal, and return a table for modeling. Native records retain raw curves, multidimensional arrays and ragged MS scans alongside their declared sample and source identities.
Installation
You can install the development version of measure from GitHub:
# install.packages("pak")
pak::pak("JamesHWade/measure")
Usage
Define a recipe, add preprocessing steps, fit it with prep(), and apply it with bake(). The recipe uses all 215 NIR spectra in meats_long; the plot compares the same ten samples before and after preprocessing.
library(measure)
library(recipes)
library(ggplot2)

# NIR spectra with measured meat composition
data(meats_long)
head(meats_long)
#> # A tibble: 6 × 6
#>      id water   fat protein channel transmittance
#>   <int> <dbl> <dbl>   <dbl>   <int>         <dbl>
#> 1     1  60.5  22.5    16.7       1          2.62
#> 2     1  60.5  22.5    16.7       2          2.62
#> 3     1  60.5  22.5    16.7       3          2.62
#> 4     1  60.5  22.5    16.7       4          2.62
#> 5     1  60.5  22.5    16.7       5          2.62
#> 6     1  60.5  22.5    16.7       6          2.62
The stored signal column is named transmittance, but contains the original absorbance values from modeldata::meats. The column name is retained for compatibility; this example does not convert the values to absorbance.
Building a preprocessing recipe
rec <- recipe(water + fat + protein ~ ., data = meats_long) |>
  # Assign sample ID role (not used as predictor)
  update_role(id, new_role = "id") |>
  # Convert long-format measurements to internal representation
  step_measure_input_long(transmittance, location = vars(channel)) |>
  # Apply Savitzky-Golay smoothing with first derivative
  step_measure_savitzky_golay(window_side = 5, differentiation_order = 1) |>
  # Standard Normal Variate normalization
  step_measure_snv() |>
  # Convert back to wide format for modeling
  step_measure_output_wide(prefix = "nir_")
Preparing and applying the recipe
# Prep learns any parameters from training data
prepped <- prep(rec)
#> Dropping 1 list column for wide output: channel

# Bake applies the transformations
processed <- bake(prepped, new_data = NULL)

# Result is ready for modeling
processed[1:5, 1:8]
#> # A tibble: 5 × 8
#>      id water   fat protein  nir_06  nir_07  nir_08  nir_09
#>   <int> <dbl> <dbl>   <dbl>   <dbl>   <dbl>   <dbl>   <dbl>
#> 1     1  60.5  22.5    16.7 -0.126  -0.110  -0.0928 -0.0745
#> 2     2  46    40.1    13.5  0.0184  0.0381  0.0601  0.0841
#> 3     3  71     8.4    20.5  0.105   0.114   0.125   0.136
#> 4     4  72.8   5.9    20.7  0.0716  0.0786  0.0871  0.0974
#> 5     5  58.3  25.5    15.5 -0.132  -0.118  -0.101  -0.0817
Visualizing the preprocessing
rec_for_viz <- recipe(water + fat + protein ~ ., data = meats_long) |>
  update_role(id, new_role = "id") |>
  step_measure_input_long(transmittance, location = vars(channel)) |>
  step_measure_savitzky_golay(window_side = 5, differentiation_order = 1) |>
  step_measure_snv()

processed_long <- bake(prep(rec_for_viz), new_data = NULL)

library(tidyr)
library(dplyr)

sample_ids <- unique(meats_long$id)[seq_len(10)]
raw_plot <- meats_long |>
  filter(id %in% sample_ids) |>
  transmute(sample_id = id, location = channel, value = transmittance,
            stage = "Recorded absorbance")
processed_plot <- processed_long |>
  filter(id %in% sample_ids) |>
  mutate(sample_id = id) |>
  unnest(.measures) |>
  transmute(sample_id, location, value, stage = "First derivative + SNV")
plot_data <- bind_rows(raw_plot, processed_plot) |>
  mutate(stage = factor(stage, levels = c(
    "Recorded absorbance", "First derivative + SNV"
  )))

ggplot(plot_data, aes(location, value, group = sample_id)) +
  geom_line(colour = "#0072B2", alpha = 0.55, linewidth = 0.4) +
  facet_wrap(vars(stage), ncol = 1, scales = "free_y") +
  labs(x = "Spectrometer channel", y = NULL) +
  theme_minimal(base_size = 12) +
  theme(
    plot.background = element_rect(fill = "white", colour = NA),
    panel.grid.minor = element_blank()
  )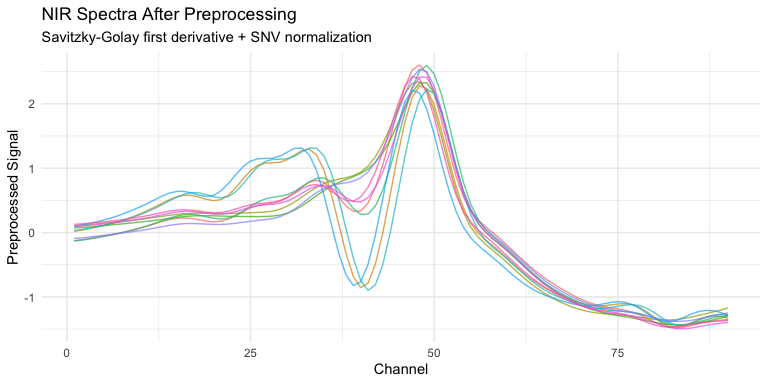
The same ten NIR samples before and after a first derivative and standard normal variate (SNV) scaling. The derivative drops five channels at each edge; SNV centers and scales each resulting spectrum. Each panel has its own response scale.
Available steps
Input/output steps
| Step | Description |
|---|---|
step_measure_input_wide() |
Convert wide format (measurements in columns) to internal format |
step_measure_input_long() |
Convert long format (measurements in rows) to internal format |
step_measure_output_wide() |
Convert back to wide format for modeling |
step_measure_output_long() |
Convert back to long format |
Spectral math
| Step | Description |
|---|---|
step_measure_absorbance() |
Convert transmittance to absorbance |
step_measure_transmittance() |
Convert absorbance to transmittance |
step_measure_log() |
Log transformation with configurable base/offset |
step_measure_kubelka_munk() |
Kubelka-Munk transformation for reflectance |
step_measure_derivative() |
Simple finite difference derivatives |
step_measure_derivative_gap() |
Gap (Norris-Williams) derivatives |
Filtering and scatter correction
| Step | Description |
|---|---|
step_measure_savitzky_golay() |
Smoothing and/or differentiation |
step_measure_snv() |
Standard Normal Variate normalization |
step_measure_msc() |
Multiplicative Scatter Correction |
step_measure_emsc() |
Extended MSC with wavelength-dependent correction |
step_measure_osc() |
Orthogonal Signal Correction |
Smoothing and noise reduction
| Step | Description |
|---|---|
step_measure_smooth_ma() |
Moving average smoothing |
step_measure_smooth_median() |
Median filter (robust to spikes) |
step_measure_smooth_gaussian() |
Gaussian kernel smoothing |
step_measure_smooth_wavelet() |
Wavelet denoising |
step_measure_filter_fourier() |
Fourier low-pass/high-pass filtering |
step_measure_despike() |
Spike/outlier detection and removal |
Sample-wise normalization
| Step | Description |
|---|---|
step_measure_normalize_sum() |
Divide by sum (total intensity) |
step_measure_normalize_max() |
Divide by maximum value |
step_measure_normalize_range() |
Scale to 0-1 range |
step_measure_normalize_vector() |
L2/Euclidean normalization |
step_measure_normalize_auc() |
Divide by area under curve |
step_measure_normalize_peak() |
Normalize by peak region (tunable) |
Variable-wise scaling
| Step | Description |
|---|---|
step_measure_center() |
Mean centering |
step_measure_scale_auto() |
Auto-scaling (z-score) |
step_measure_scale_pareto() |
Pareto scaling |
step_measure_scale_range() |
Range scaling |
step_measure_scale_vast() |
VAST scaling |
Baseline correction
| Step | Description |
|---|---|
step_measure_baseline_als() |
Asymmetric least squares |
step_measure_baseline_poly() |
Polynomial baseline fitting |
step_measure_baseline_rf() |
Rolling ball/LOESS baseline |
step_measure_baseline_rolling() |
Rolling ball algorithm |
step_measure_baseline_airpls() |
Adaptive Iteratively Reweighted PLS |
step_measure_baseline_arpls() |
Asymmetrically Reweighted PLS |
step_measure_baseline_snip() |
SNIP (Statistics-sensitive Non-linear Iterative Peak-clipping) |
step_measure_baseline_tophat() |
Top-hat morphological filter |
step_measure_baseline_morph() |
Iterative morphological correction |
step_measure_baseline_minima() |
Local minima interpolation |
step_measure_baseline_auto() |
Automatic method selection |
step_measure_detrend() |
Polynomial detrending |
Reference corrections
| Step | Description |
|---|---|
step_measure_subtract_blank() |
Blank/background subtraction |
step_measure_subtract_reference() |
Reference spectrum subtraction |
step_measure_ratio_reference() |
Reference ratio with optional blank |
Region operations
| Step | Description |
|---|---|
step_measure_trim() |
Keep measurements within specified x-range |
step_measure_exclude() |
Remove measurements within specified range(s) |
step_measure_resample() |
Interpolate to new regular grid |
Alignment and registration
| Step | Description |
|---|---|
step_measure_align_shift() |
Cross-correlation shift alignment |
step_measure_align_reference() |
Align to external reference spectrum |
step_measure_align_dtw() |
Dynamic Time Warping alignment |
step_measure_align_ptw() |
Parametric Time Warping |
step_measure_align_cow() |
Correlation Optimized Warping (tunable) |
Quality control
| Step | Description |
|---|---|
step_measure_qc_snr() |
Calculate signal-to-noise ratio |
step_measure_qc_saturated() |
Detect saturated measurements |
step_measure_qc_outlier() |
Detect outlier samples |
step_measure_impute() |
Interpolate missing values |
Peak operations
| Step | Description |
|---|---|
step_measure_peaks_detect() |
Detect peaks using prominence or derivative methods |
step_measure_peaks_integrate() |
Calculate peak areas |
step_measure_peaks_filter() |
Filter peaks by height, area, or count |
step_measure_peaks_deconvolve() |
Deconvolve overlapping peaks |
step_measure_peaks_to_table() |
Convert peaks to wide format for modeling |
SEC/GPC analysis
Use measure.sec for SEC detector processing, molecular-weight calibration and distribution calculations.
Feature engineering
| Step | Description |
|---|---|
step_measure_integrals() |
Calculate integrated areas for specified regions |
step_measure_ratios() |
Calculate ratios between integrated regions |
step_measure_moments() |
Calculate statistical moments from spectra |
step_measure_bin() |
Reduce spectrum to fewer points via binning |
Data augmentation
| Step | Description |
|---|---|
step_measure_augment_noise() |
Add random noise for training augmentation |
step_measure_augment_shift() |
Random x-axis shifts for shift invariance |
step_measure_augment_scale() |
Random intensity scaling |
Drift and batch correction
| Step/Function | Description |
|---|---|
step_measure_drift_qc_loess() |
QC-RLSC drift correction using LOESS |
step_measure_drift_linear() |
Linear drift correction |
step_measure_drift_spline() |
Spline-based drift correction |
step_measure_qc_bracket() |
QC bracketing interpolation |
step_measure_batch_reference() |
Reference-based batch correction |
measure_detect_drift() |
Detect significant drift in QC samples |
Analytical validation functions
Validation functions calculate calibration diagnostics, precision, recovery, uncertainty and control limits. Select acceptance criteria for the intended method and check the assumptions of each calculation.
Calibration and quantitation
| Function | Description |
|---|---|
measure_calibration_fit() |
Fit weighted calibration curves (linear/quadratic) |
measure_calibration_predict() |
Predict concentrations with uncertainty |
measure_calibration_verify() |
Continuing calibration verification |
measure_lod() / measure_loq()
|
Detection and quantitation limits |
Precision and accuracy
| Function | Description |
|---|---|
measure_repeatability() |
Within-run precision |
measure_intermediate_precision() |
Between-run precision with variance components |
measure_reproducibility() |
Between-lab precision |
measure_gage_rr() |
Gage R&R / Measurement System Analysis |
measure_accuracy() |
Bias, recovery, and accuracy assessment |
measure_linearity() |
Linearity with lack-of-fit testing |
measure_carryover() |
Carryover evaluation |
Method comparison
| Function | Description |
|---|---|
measure_bland_altman() |
Bland-Altman analysis with limits of agreement |
measure_deming_regression() |
Deming regression for method comparison |
measure_passing_bablok() |
Passing-Bablok non-parametric regression |
measure_proficiency_score() |
z-scores, En scores, zeta scores for PT |
Matrix effects and sample preparation QC
| Function/Step | Description |
|---|---|
measure_matrix_effect() |
Quantify ion suppression/enhancement |
step_measure_standard_addition() |
Standard addition correction |
step_measure_dilution_correct() |
Back-calculate diluted concentrations |
step_measure_surrogate_recovery() |
Surrogate/internal standard recovery |
Uncertainty and quality control
| Function | Description |
|---|---|
measure_uncertainty_budget() |
ISO GUM uncertainty budgets |
measure_uncertainty() |
Combined and expanded uncertainty |
measure_control_limits() |
Shewhart, EWMA, or CUSUM limits |
measure_control_chart() |
Westgard multi-rule control charts |
measure_system_suitability() |
System suitability testing |
Acceptance criteria
| Function | Description |
|---|---|
measure_criteria() |
Define acceptance criteria |
measure_assess() |
Evaluate data against criteria |
criteria_bioanalytical() |
FDA/EMA bioanalytical presets |
criteria_ich_q2() |
ICH Q2 validation presets |
Datasets
Included datasets
The package includes datasets for examples and testing:
| Dataset | Technique | Samples | Description |
|---|---|---|---|
meats_long |
NIR | 215 | NIR absorbance spectra of meat samples (from modeldata) |
bioreactors_small |
Raman | 210 | Raman spectra from 15 small-scale bioreactors |
bioreactors_large |
Raman | 42 | Raman spectra from 3 large-scale bioreactors |
hplc_chromatograms |
HPLC-UV | 20 | Simulated HPLC chromatograms with 5 compounds |
sec_chromatograms |
SEC/GPC | 10 | Simulated SEC chromatograms (5 standards + 5 polymers) |
sec_calibration |
SEC/GPC | 5 | Calibration standards for molecular weight curves |
maldi_spectra |
MALDI-TOF | 16 | Simulated mass spectra (4 groups × 4 replicates) |
External data sources
For additional test data beyond what’s included with measure, these sources provide publicly available analytical measurement data:
R packages with spectral data:
| Package | Dataset | Technique | Description |
|---|---|---|---|
| modeldata | meats |
NIR | Meat composition (wide format version) |
| prospectr | NIRsoil |
NIR | Soil analysis with 825 samples |
| ChemoSpec | Various | IR, NMR | Multiple spectroscopy datasets |
| hyperSpec | Various | Raman, IR | Hyperspectral data examples |
# Example: Load NIRsoil from prospectr
# install.packages("prospectr")
data(NIRsoil, package = "prospectr")
Online repositories:
- Mendeley Data - Search “spectroscopy”, “chromatography”, or “mass spectrometry”
- Zenodo - Open science data repository
- Kaggle Datasets - Community-contributed datasets
- NIST Chemistry WebBook - Reference spectra (IR, MS, UV-Vis)
- SDBS - Spectral Database for Organic Compounds (NMR, IR, MS)
Domain-Specific Databases:
| Database | Data Type | URL |
|---|---|---|
| MassBank | Mass spectra | https://massbank.eu/MassBank/ |
| HMDB | NMR, MS metabolomics | https://hmdb.ca/ |
| NMRShiftDB | NMR spectra | https://nmrshiftdb.nmr.uni-koeln.de/ |
| Crystallography Open Database | XRD patterns | https://www.crystallography.net/cod/ |
Related packages
measure builds on the tidymodels ecosystem:
- recipes - The foundation for preprocessing pipelines
- parsnip - Unified modeling interface
- workflows - Bundle preprocessing and modeling
- tune - Hyperparameter tuning (works with measure’s tunable steps!)
For spectral analysis in R, you might also find these packages useful:
Contributing
This package is under active development. Contributions are welcome! Please see the contributing guidelines.
Code of conduct
Please note that the measure project is released with a Contributor Code of Conduct. By contributing to this project, you agree to abide by its terms.