
Tutorial: bioreactor glucose prediction
Source:vignettes/articles/tutorial-bioreactor.Rmd
tutorial-bioreactor.Rmd
library(measure)
library(recipes)
library(dplyr)
library(tidyr)
library(ggplot2)

article_plot_theme <- ggplot2::theme_minimal(base_size = 12) +
  ggplot2::theme(
    text = ggplot2::element_text(colour = "#222222"),
    plot.background = ggplot2::element_rect(fill = "white", colour = NA),
    panel.background = ggplot2::element_rect(fill = "white", colour = NA),
    legend.background = ggplot2::element_rect(fill = "white", colour = NA),
    legend.key = ggplot2::element_rect(fill = "white", colour = NA),
    strip.background = ggplot2::element_rect(fill = "white", colour = NA)
  )
Introduction
This tutorial applies measure preprocessing to Raman spectra from small-scale bioreactors, fits a linear model for glucose, and applies the fitted recipe and model to records from large-scale reactors.
The dataset
The glucose_bioreactors dataset contains Raman assay
values, glucose measurements, sampling days, and reactor identifiers. It
includes 15 small- scale reactors and three large-scale reactors
monitored over 14 days; both sets came from the same batch of cells. The
data are described in Kuhn and Johnson’s Feature Engineering and
Selection (2020).
data(glucose_bioreactors)

# Small-scale bioreactors (15 reactors, 14 days)
dim(bioreactors_small)
#> [1]  210 2655

# Large-scale bioreactors (3 reactors, 14 days)
dim(bioreactors_large)
#> [1]   42 2655
Each dataset has: - 2,651 spectral channels (Raman wavenumbers) -
glucose: the target variable to predict - day:
sampling day (1-14) - batch_id and
batch_sample: reactor identifiers
Exploring the spectra
The chart uses the first 500 of 2,651 spectral coordinates from 10 small-scale records. Color represents the recorded glucose concentration.
# Get spectral column names (numeric wavenumbers)
spec_cols <- names(bioreactors_small)[sapply(names(bioreactors_small), function(x) !is.na(suppressWarnings(as.numeric(x))))]

# Convert a few samples to long format for plotting
viz_data <- bioreactors_small |>
  slice(1:10) |>
  mutate(sample_id = row_number()) |>
  select(sample_id, glucose, all_of(spec_cols[1:500])) |>  # First 500 channels
  pivot_longer(
    cols = -c(sample_id, glucose),
    names_to = "wavenumber",
    values_to = "intensity"
  ) |>
  mutate(wavenumber = as.numeric(wavenumber))

ggplot(viz_data, aes(x = wavenumber, y = intensity, group = sample_id, color = glucose)) +
  geom_line(alpha = 0.7) +
  scale_color_viridis_c() +
  labs(
    x = "Raman wavenumber (dataset coordinate)",
    y = "Assay intensity (dataset scale)",
    title = "Small-scale bioreactor spectra",
    color = "Glucose concentration (dataset scale)"
  ) +
  article_plot_theme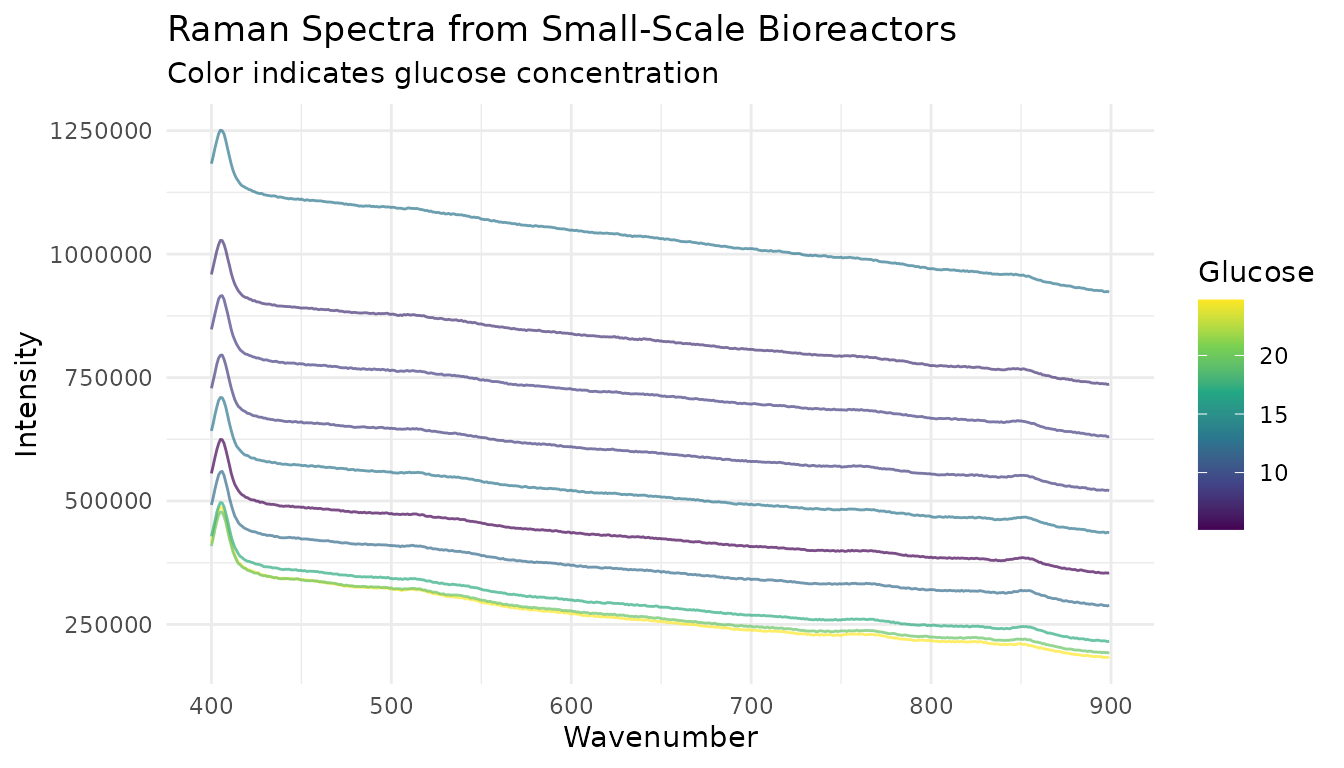
First 500 Raman coordinates for 10 small-scale records. Color encodes each record’s glucose concentration.
Building a preprocessing recipe
This recipe applies a Savitzky-Golay first derivative followed by SNV. These steps change the scale and shape of the spectra; inspect the processed traces before using them for a scientific interpretation.
# Use the first 500 spectral columns in this example
spec_cols_subset <- spec_cols[1:500]
wavenumbers <- as.numeric(spec_cols_subset)

# Prepare training data
train_data <- bioreactors_small |>
  select(glucose, day, batch_id, all_of(spec_cols_subset))

# Create preprocessing recipe
rec <- recipe(glucose ~ ., data = train_data) |>
  # Don't use day and batch_id as predictors
  update_role(day, batch_id, new_role = "id") |>
  # Convert wide spectral columns to internal format
  step_measure_input_wide(
    all_of(spec_cols_subset),
    location_values = wavenumbers
  ) |>
  # Savitzky-Golay smoothing + first derivative
  step_measure_savitzky_golay(
    window_side = 7,
    differentiation_order = 1
  ) |>
  # Standard Normal Variate normalization
  step_measure_snv() |>
  # Convert back to wide format
  step_measure_output_wide(prefix = "raman_")

rec
#>
#> ── Recipe ──────────────────────────────────────────────────────────────────────
#>
#> ── Inputs
#> Number of variables by role
#> outcome:     1
#> predictor: 500
#> id:          2
#>
#> ── Operations
#> • Collate wide analytical measurements: all_of(spec_cols_subset)
#> Savitzky-Golay preprocessing on
#> SNV transformation on
#> • Restructure analytical measurements to wide format: "<internal data>"
Preparing the data
# Prep the recipe (learns parameters from training data)
rec_prepped <- prep(rec)

# Bake to get preprocessed data
train_processed <- bake(rec_prepped, new_data = NULL)

# Check dimensions
dim(train_processed)
#> [1] 210 489
The preprocessed data has fewer columns because: - The
day and batch_id columns are preserved as ID
columns - The 500 spectral columns have been transformed and renamed
with prefix raman_
Inspecting preprocessed spectra
# Get preprocessed spectral columns
proc_cols <- names(train_processed)[grepl("^raman_", names(train_processed))]

proc_viz <- train_processed |>
  slice(1:10) |>
  mutate(sample_id = row_number()) |>
  select(sample_id, glucose, all_of(proc_cols)) |>
  pivot_longer(
    cols = starts_with("raman_"),
    names_to = "feature",
    values_to = "value"
  ) |>
  mutate(wavenumber = as.numeric(gsub("raman_", "", feature)))

ggplot(proc_viz, aes(x = wavenumber, y = value, group = sample_id, color = glucose)) +
  geom_line(alpha = 0.7) +
  scale_color_viridis_c() +
  labs(
    x = "Raman wavenumber (dataset coordinate)",
    y = "Processed signal (SNV scale)",
    title = "Processed small-scale spectra",
    color = "Glucose concentration (dataset scale)"
  ) +
  article_plot_theme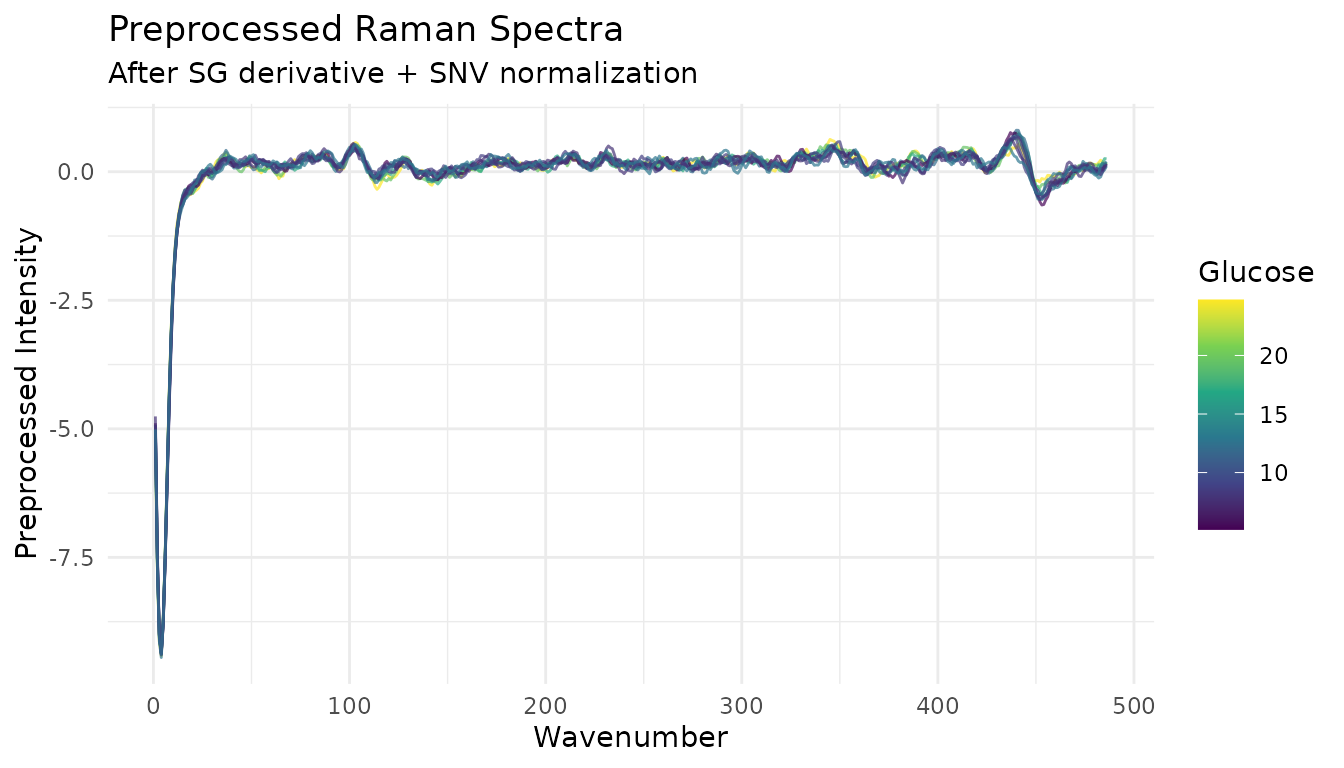
The same 10 small-scale records after Savitzky-Golay first-derivative processing and SNV.
Fitting a model
The example fits a linear model to the preprocessed small-scale records.
library(parsnip)

# Small linear-model example
lm_spec <- linear_reg() |>
  set_engine("lm")

# Fit model
model <- lm_spec |>
  fit(glucose ~ ., data = train_processed |> select(-day, -batch_id))

# In-sample training summary; this is not a held-out performance estimate.
train_preds <- predict(model, train_processed) |>
  bind_cols(train_processed |> select(glucose))

train_preds |>
  summarize(
    rmse = sqrt(mean((glucose - .pred)^2)),
    r_squared = cor(glucose, .pred)^2
  )
#> # A tibble: 1 × 2
#>       rmse r_squared
#>      <dbl>     <dbl>
#> 1 2.29e-12         1
Applying the recipe and model to new records
The fitted recipe applies its small-scale estimates to records from the large- scale reactors.
# Prepare large-scale records
large_data <- bioreactors_large |>
  select(glucose, day, batch_id, all_of(spec_cols_subset))

# Apply the fitted preprocessing and predict
large_processed <- bake(rec_prepped, new_data = large_data)
large_preds <- predict(model, large_processed) |>
  bind_cols(large_processed |> select(glucose, batch_id, day))
#> Warning in predict.lm(object = object$fit, newdata = new_data, type =
#> "response", : prediction from rank-deficient fit; consider predict(.,
#> rankdeficient="NA")

# Compare predictions with observed glucose values
ggplot(large_preds, aes(x = glucose, y = .pred, color = batch_id)) +
  geom_point(alpha = 0.7) +
  geom_abline(slope = 1, intercept = 0, linetype = "dashed") +
  labs(
    x = "Observed glucose (dataset scale)",
    y = "Predicted glucose (dataset scale)",
    title = "Large-scale reactor records",
    color = "Reactor ID"
  ) +
  article_plot_theme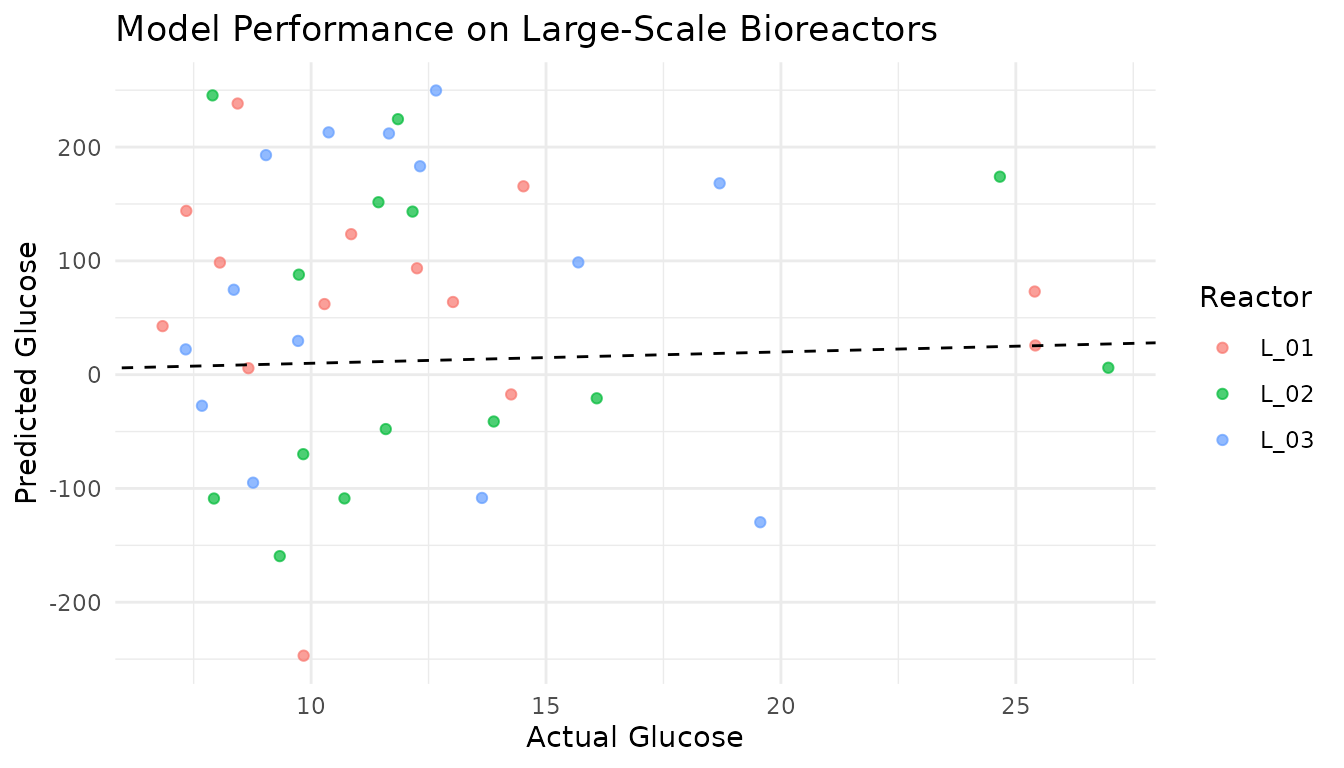
Predicted versus recorded glucose for 42 large-scale records. The dashed line marks equal observed and predicted values; color identifies reactor.
Interpretation
The training metrics are in-sample summaries. The final chart compares model predictions with recorded glucose for the three large-scale reactors in this dataset. Those records came from the same cell batch as the small-scale data, so this example does not establish performance on a new study or cell batch. Most large-scale predictions are also far from the equal-value reference line.
For a study, keep preprocessing within the resampling workflow, compare model and preprocessing choices on training data, and use data from the intended application setting for final evaluation.
See also
- Getting Started - Fundamentals of measure
- Integrating with tidymodels - Advanced modeling workflows with tuning
- Preprocessing Reference - Complete guide to preprocessing techniques