
Reference: Preprocessing Techniques
Source:vignettes/articles/reference-preprocessing.Rmd
reference-preprocessing.Rmd
library(measure)
library(recipes)
library(dplyr)
library(tidyr)
library(ggplot2)
library(modeldata)

# Helper function to process and plot spectra
theme_measure <- function() {
  theme_minimal(base_size = 11) +
    theme(
      panel.grid.minor = element_blank(),
      panel.background = element_rect(fill = "white", colour = NA),
      plot.background = element_rect(fill = "white", colour = NA),
      legend.background = element_rect(fill = "white", colour = NA)
    )
}

plot_spectra <- function(
  data,
  title,
  subtitle = NULL,
  y_label = "Response (transformed scale)"
) {
  ggplot(data, aes(x = location, y = value, group = sample_id)) +
    geom_line(colour = "#286B8E", alpha = 0.55, linewidth = 0.45) +
    labs(
      x = "Example coordinate",
      y = y_label,
      title = title,
      subtitle = subtitle
    ) +
    theme_measure()
}

# Prepare sample data
data(meats)
example_grid <- seq(850, 1050, length.out = 100)

# Get spectra in internal format for demonstrations
get_internal <- function(rec) {
  bake(prep(rec), new_data = NULL) |>
    slice(1:15) |>
    mutate(sample_id = row_number()) |>
    unnest(.measures)
}
Introduction
Spectral preprocessing can reduce variation associated with effects
such as scatter and baseline drift before chemometric modeling. The
appropriate transformations depend on the measurement and analysis goal.
This reference shows preprocessing steps available in
measure and the data they return.
Fit on training data, then bake new data
A recipe learns preprocessing parameters from its training rows. Keep
the test or assessment rows separate until bake(), and mark
a sample identifier as an ID role so it is preserved without being used
as a predictor.
set.seed(2026)
meats_with_id <- meats |>
  mutate(sample_id = dplyr::row_number())
training_rows <- sample.int(
  nrow(meats_with_id),
  size = floor(0.8 * nrow(meats_with_id))
)
meats_training <- meats_with_id[training_rows, ]
meats_assessment <- meats_with_id[-training_rows, ]

rec_train <- recipe(water ~ ., data = meats_training) |>
  update_role(sample_id, new_role = "id") |>
  step_measure_input_wide(
    starts_with("x_"),
    location_values = example_grid
  ) |>
  step_measure_snv() |>
  step_measure_output_wide(prefix = "nir_")

rec_fit <- prep(rec_train)
training_baked <- bake(rec_fit, new_data = NULL)
assessment_baked <- bake(rec_fit, new_data = meats_assessment)

assessment_baked |>
  select(sample_id, starts_with("nir_")) |>
  head()
#> # A tibble: 6 × 101
#>   sample_id nir_0850.0000 nir_0852.0202 nir_0854.0404 nir_0856.0606
#>       <int>         <dbl>         <dbl>         <dbl>         <dbl>
#> 1         7         -1.82         -1.80         -1.78         -1.75
#> 2         9         -1.55         -1.53         -1.51         -1.49
#> 3        24         -1.58         -1.56         -1.53         -1.51
#> 4        25         -1.19         -1.19         -1.18         -1.18
#> 5        26         -1.06         -1.07         -1.09         -1.10
#> 6        37         -1.37         -1.37         -1.37         -1.36
#> # ℹ 96 more variables: nir_0858.0808 <dbl>, nir_0860.1010 <dbl>,
#> #   nir_0862.1212 <dbl>, nir_0864.1414 <dbl>, nir_0866.1616 <dbl>,
#> #   nir_0868.1818 <dbl>, nir_0870.2020 <dbl>, nir_0872.2222 <dbl>,
#> #   nir_0874.2424 <dbl>, nir_0876.2626 <dbl>, nir_0878.2828 <dbl>,
#> #   nir_0880.3030 <dbl>, nir_0882.3232 <dbl>, nir_0884.3434 <dbl>,
#> #   nir_0886.3636 <dbl>, nir_0888.3838 <dbl>, nir_0890.4040 <dbl>,
#> #   nir_0892.4242 <dbl>, nir_0894.4444 <dbl>, nir_0896.4646 <dbl>, …
The example_grid vector follows the selected
x_ columns in their data order. This is an arbitrary grid
from 850 to 1050, not physical wavelengths: the source data does not
include a per-channel wavelength map. The same locations are stored
during prep() and used when baking assessment rows. Their
sample_id values remain alongside the processed
measurements. The source meats dataset records absorbance
values.
Why preprocess spectra?
The meats dataset contains source absorbance profiles.
The example assigns the coordinate grid described above and plots the
first 15 samples:
rec_raw <- recipe(water ~ ., data = meats) |>
  step_measure_input_wide(starts_with("x_"), location_values = example_grid)

raw_data <- get_internal(rec_raw)

plot_spectra(
  raw_data,
  "Raw NIR Spectra",
  "First 15 samples",
  y_label = "Absorbance (original data scale)"
)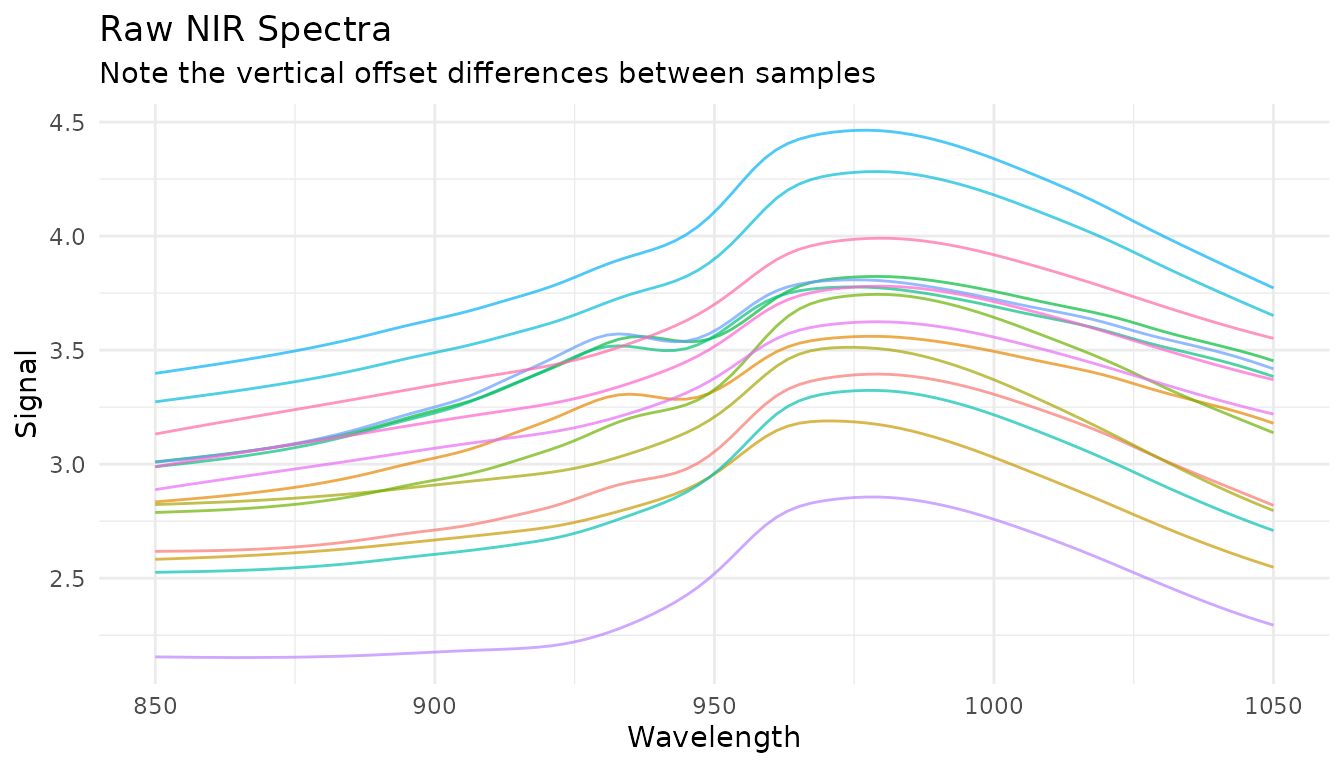
The first 15 absorbance spectra from the meats dataset are
overlaid across the example example coordinates before preprocessing.
The overlay shows variation in the source absorbance profiles. This plot alone does not separate chemical variation from effects such as particle size, path length, or light scatter. Preprocessing steps can target particular sources of variation, but their output should be checked against the measurement context.
Savitzky-Golay Filtering
What it does
The Savitzky-Golay filter performs polynomial smoothing and can compute derivatives. It fits a polynomial to a sliding window of points, using the polynomial’s value (or derivative) at the center point as the output.
When to use it
- Smoothing (order = 0): Reduce random noise while preserving peak shapes
- First derivative (order = 1): Remove constant baseline offsets, enhance peak differences
- Second derivative (order = 2): Remove linear baseline trends and emphasize curvature
Parameters
-
window_side: Number of points on each side of the center point (total window = 2 * window_side + 1) -
differentiation_order: 0 for smoothing, 1 for first derivative, 2 for second derivative -
degree: Polynomial degree (defaults to 3)
Examples
# Just smoothing
rec_smooth <- recipe(water ~ ., data = meats) |>
  step_measure_input_wide(starts_with("x_"), location_values = example_grid) |>
  step_measure_savitzky_golay(window_side = 7, differentiation_order = 0)

# First derivative
rec_d1 <- recipe(water ~ ., data = meats) |>
  step_measure_input_wide(starts_with("x_"), location_values = example_grid) |>
  step_measure_savitzky_golay(window_side = 5, differentiation_order = 1)

# Second derivative
rec_d2 <- recipe(water ~ ., data = meats) |>
  step_measure_input_wide(starts_with("x_"), location_values = example_grid) |>
  step_measure_savitzky_golay(window_side = 7, differentiation_order = 2)
sg_data <- dplyr::bind_rows(
  raw_data |>
    filter(sample_id == 1) |>
    mutate(method = "Raw"),
  get_internal(rec_smooth) |>
    filter(sample_id == 1) |>
    mutate(method = "Smoothed, window_side = 7"),
  get_internal(rec_d1) |>
    filter(sample_id == 1) |>
    mutate(method = "First derivative, window_side = 5"),
  get_internal(rec_d2) |>
    filter(sample_id == 1) |>
    mutate(method = "Second derivative, window_side = 7")
)
sg_data$method <- factor(
  sg_data$method,
  levels = c(
    "Raw",
    "Smoothed, window_side = 7",
    "First derivative, window_side = 5",
    "Second derivative, window_side = 7"
  )
)

ggplot(sg_data, aes(x = location, y = value)) +
  geom_line(colour = "#2166AC", linewidth = 0.7) +
  facet_wrap(~method, ncol = 2, scales = "free_y") +
  labs(
    x = "Example coordinate",
    y = "Response (method scale)"
  ) +
  theme_measure()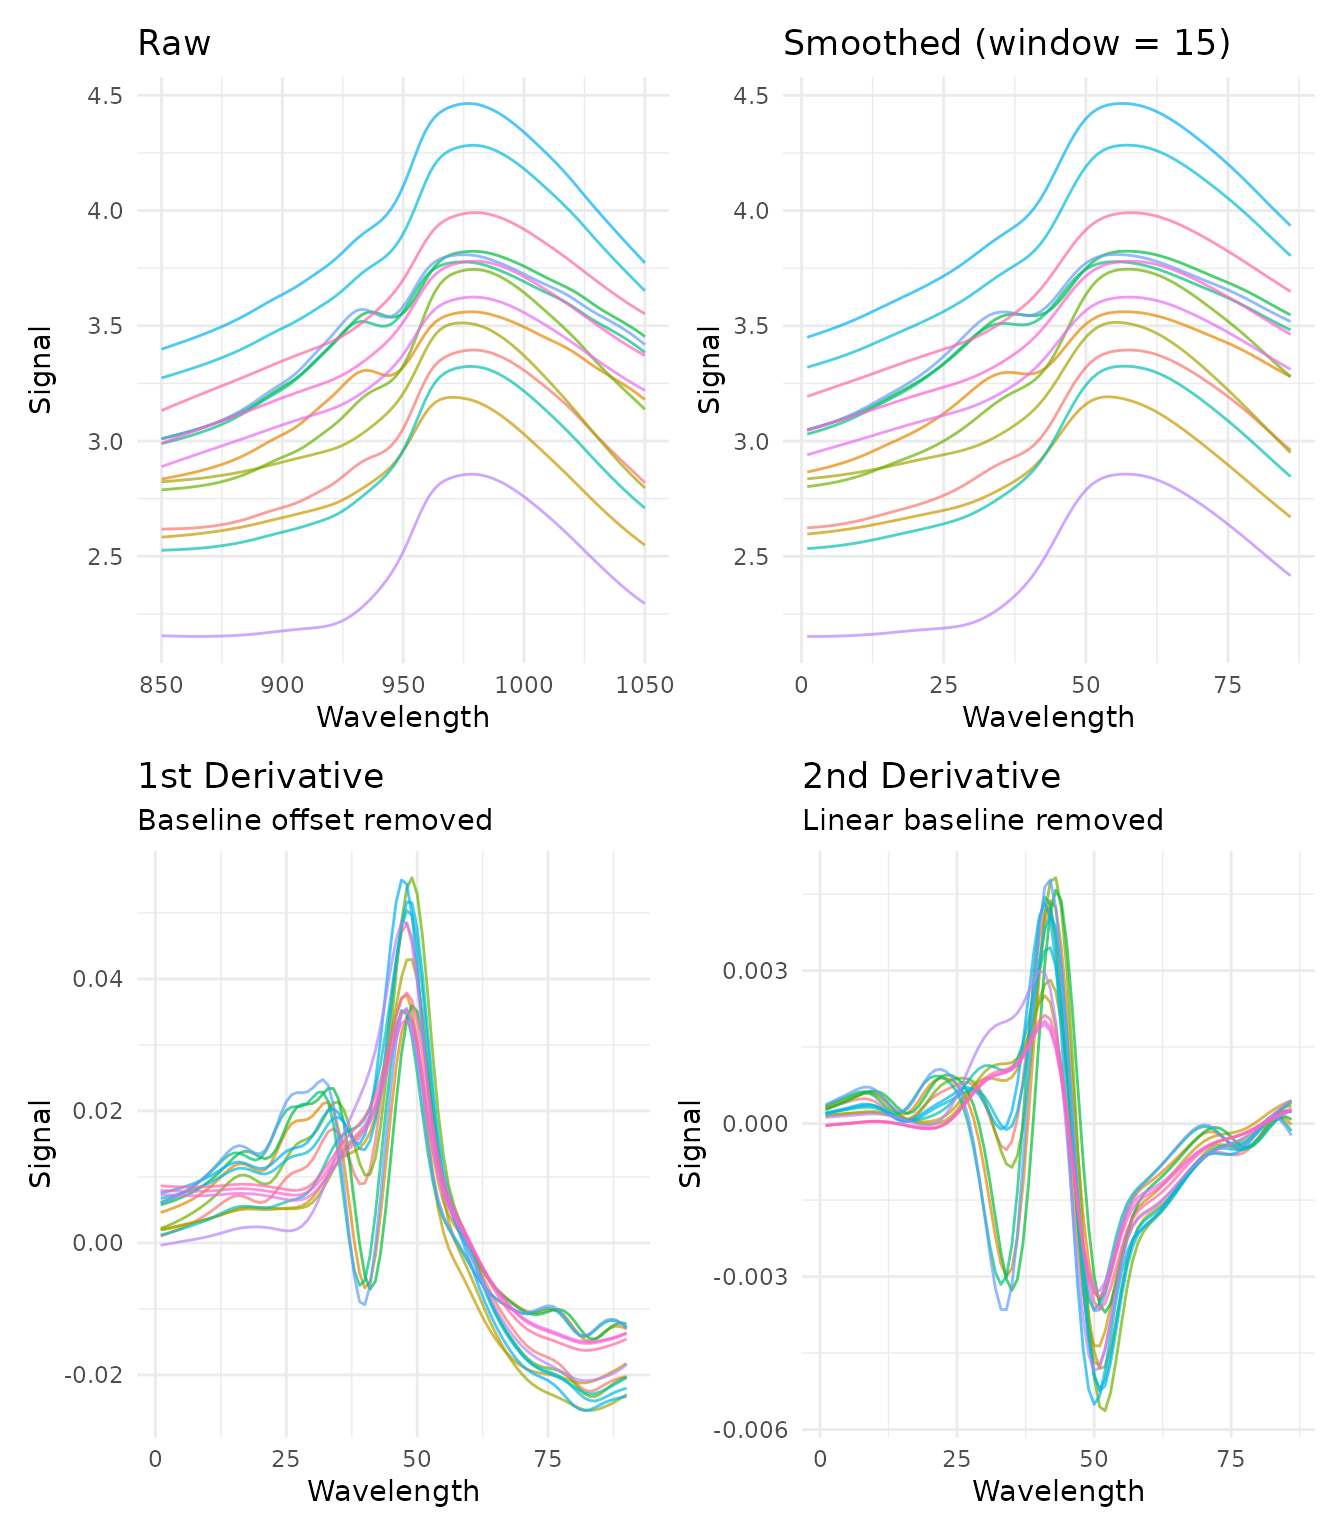
Four views of the first spectrum: raw absorbance, Savitzky-Golay smoothing, first derivative, and second derivative. Each panel uses its own y-axis scale because the transformations change the response scale.
Choosing window size
The window size is a bias-variance trade-off: - Smaller window: Less smoothing, preserves sharp features, more noise - Larger window: More smoothing, may blur sharp peaks, less noise
A good starting point is a window that spans the narrowest feature you want to preserve.
windows <- c(3, 7, 15)

window_data <- lapply(windows, function(w) {
  rec <- recipe(water ~ ., data = meats) |>
    step_measure_input_wide(starts_with("x_"), location_values = example_grid) |>
    step_measure_savitzky_golay(window_side = w, differentiation_order = 1)

  get_internal(rec) |>
    filter(sample_id == 1) |>
    mutate(window = paste0("window_side = ", w))
}) |>
  bind_rows()

ggplot(window_data, aes(x = location, y = value, colour = window)) +
  geom_line(linewidth = 0.7) +
  labs(
    x = "Example coordinate",
    y = "First derivative (response change)",
    color = NULL
  ) +
  theme_measure()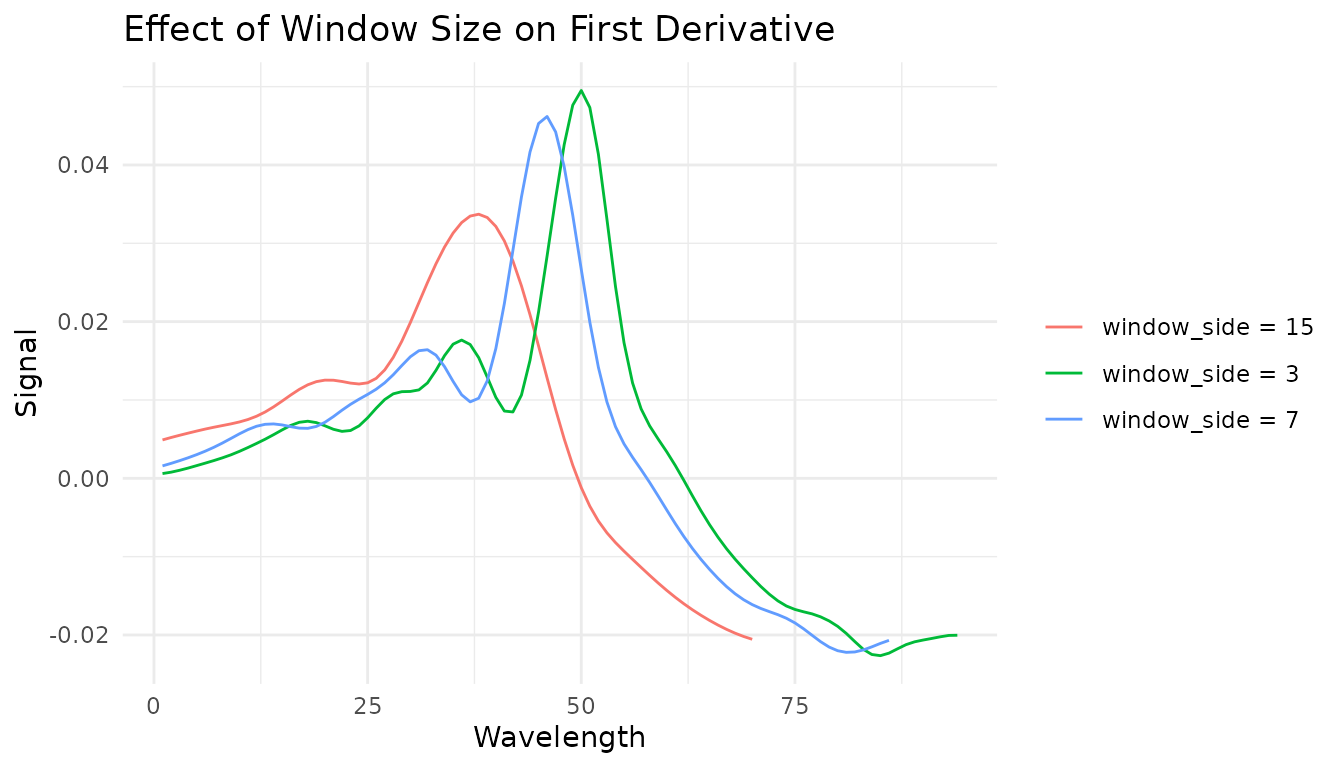
First-derivative output for sample 1 with window_side values 3, 7, and 15. The line colour identifies the window setting.
Tuning with dials
The Savitzky-Golay step is tunable! This means you can use
tune() to find optimal parameters:
rec_tunable <- recipe(water ~ ., data = meats) |>
  step_measure_input_wide(starts_with("x_")) |>
  step_measure_savitzky_golay(
    window_side = tune::tune(),
    differentiation_order = tune::tune()
  ) |>
  step_measure_output_wide()

tune::tunable(rec_tunable)
#> # A tibble: 3 × 5
#>   name                  call_info        source component           component_id
#>   <chr>                 <list>           <chr>  <chr>               <chr>
#> 1 window_side           <named list [2]> recipe step_measure_savit… measure_sav…
#> 2 differentiation_order <named list [2]> recipe step_measure_savit… measure_sav…
#> 3 degree                <named list [3]> recipe step_measure_savit… measure_sav…
Spectral Math Transformations
The measure package includes mathematical transformations commonly used in spectroscopy and chemometrics.
Absorbance and Transmittance
Convert between transmittance and absorbance using the Beer-Lambert relationship:
- Absorbance:
- Transmittance:
transmittance_data <- tibble::tibble(
  sample_id = 1:3,
  water = c(9, 10, 11),
  t_850 = c(0.85, 0.70, 0.62),
  t_920 = c(0.80, 0.65, 0.58),
  t_990 = c(0.70, 0.55, 0.50),
  t_1050 = c(0.75, 0.62, 0.57)
)
transmittance_locations <- c(850, 920, 990, 1050)

transmittance_recipe <- recipe(water ~ ., data = transmittance_data) |>
  update_role(sample_id, new_role = "id") |>
  step_measure_input_wide(
    starts_with("t_"),
    location_values = transmittance_locations
  )

rec_abs <- transmittance_recipe |>
  step_measure_absorbance()

absorbance_data <- bake(prep(rec_abs), new_data = NULL) |>
  unnest(.measures)

plot_spectra(
  absorbance_data,
  "Transmittance converted to absorbance",
  y_label = "Absorbance (simulated scale)"
)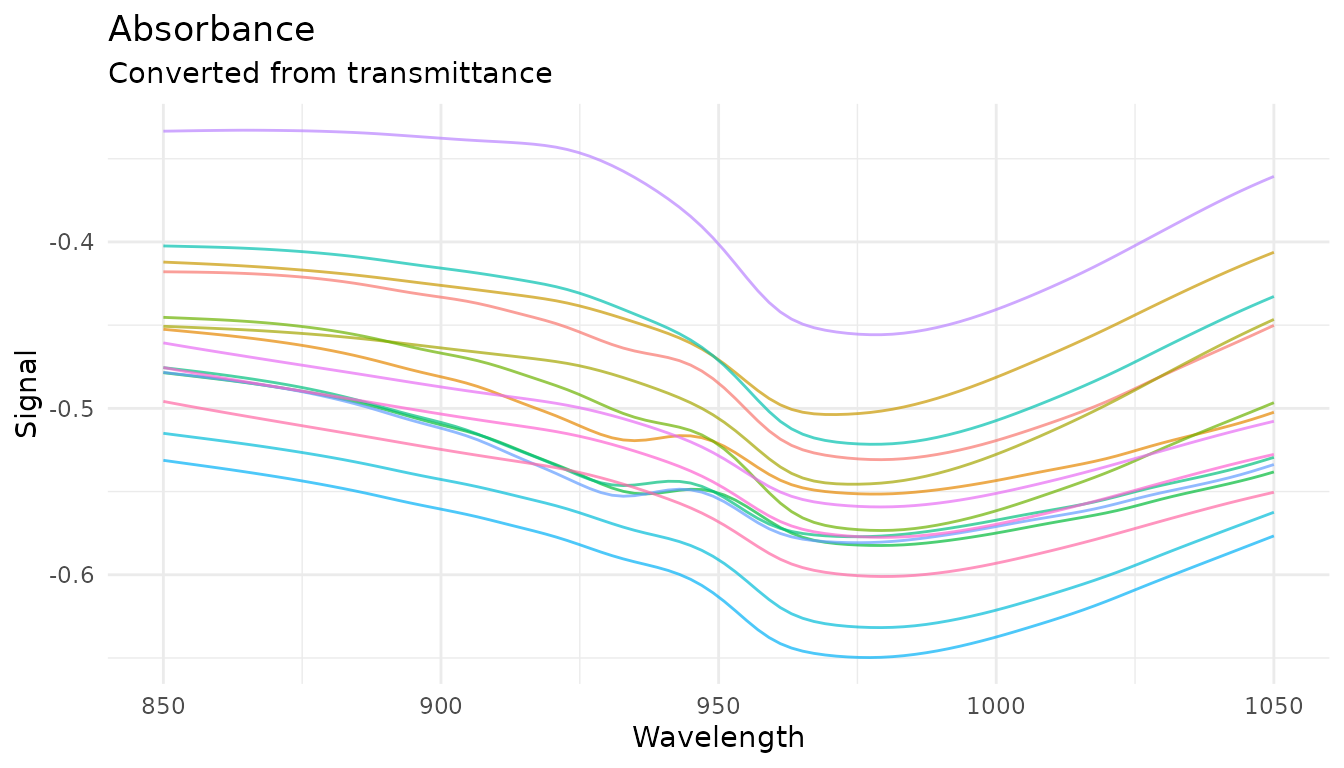
Three synthetic transmittance profiles converted to absorbance with
step_measure_absorbance(). The input and output share the
example coordinate grid.
For positive transmittance values, these transformations are
inverses. The round-trip below uses the synthetic transmittance input;
the source meats dataset already contains absorbance
values:
rec_roundtrip <- transmittance_recipe |>
  step_measure_absorbance() |>
  step_measure_transmittance()

raw_measure_data <- bake(prep(transmittance_recipe), new_data = NULL)
roundtrip_data <- bake(prep(rec_roundtrip), new_data = NULL)
all.equal(
  raw_measure_data$.measures[[1]]$value,
  roundtrip_data$.measures[[1]]$value,
  tolerance = 1e-10
)
#> [1] TRUE
Log Transformation
Apply logarithmic transformation with configurable base and offset:
# Natural log (base e)
rec_log <- recipe(water ~ ., data = meats) |>
  step_measure_input_wide(starts_with("x_"), location_values = example_grid) |>
  step_measure_log()

# Log base 10 with offset for handling zeros
rec_log10 <- recipe(water ~ ., data = meats) |>
  step_measure_input_wide(starts_with("x_"), location_values = example_grid) |>
  step_measure_log(base = 10, offset = 1)

plot_spectra(get_internal(rec_log), "Natural Log Transform")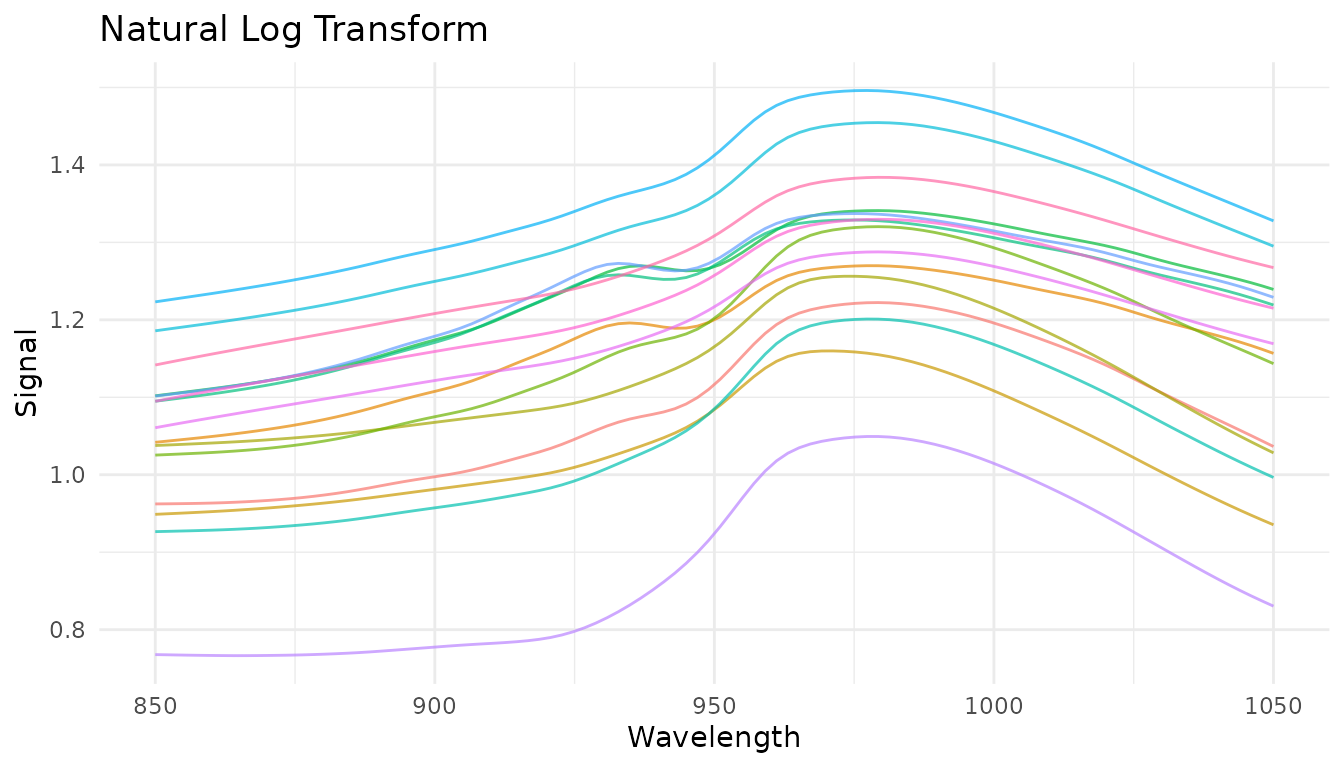
The first 15 spectra after the default natural-log transformation. Values are plotted on the transformed response scale.
Kubelka-Munk Transformation
For diffuse reflectance data, the Kubelka-Munk transformation converts reflectance to a quantity proportional to concentration:
# A small synthetic reflectance dataset with values between 0 and 1
reflectance_data <- tibble::tibble(
  concentration = c(1, 2, 3),
  r_400 = c(0.20, 0.25, 0.30),
  r_500 = c(0.30, 0.35, 0.40),
  r_600 = c(0.40, 0.45, 0.50)
)

rec_km <- recipe(concentration ~ ., data = reflectance_data) |>
  step_measure_input_wide(starts_with("r_")) |>
  step_measure_kubelka_munk()

bake(prep(rec_km), new_data = NULL)
#> # A tibble: 3 × 2
#>   concentration .measures
#>           <dbl>    <meas>
#> 1             1   [3 × 2]
#> 2             2   [3 × 2]
#> 3             3   [3 × 2]
Simple Finite Difference Derivatives
For quick derivatives without smoothing, use
step_measure_derivative():
# First derivative - removes constant baseline offsets
rec_fd1 <- recipe(water ~ ., data = meats) |>
  step_measure_input_wide(starts_with("x_"), location_values = example_grid) |>
  step_measure_derivative(order = 1)

# Second derivative - removes linear baseline trends
rec_fd2 <- recipe(water ~ ., data = meats) |>
  step_measure_input_wide(starts_with("x_"), location_values = example_grid) |>
step_measure_derivative(order = 2)Note: Derivatives reduce spectrum length (first
derivative: n-1 points, second derivative: n-2 points). The
order parameter is tunable.
Gap (Norris-Williams) Derivatives
Gap derivatives compute differences between points separated by a gap, commonly used in NIR chemometrics:
# Gap derivative with gap=5
rec_gap <- recipe(water ~ ., data = meats) |>
  step_measure_input_wide(starts_with("x_"), location_values = example_grid) |>
  step_measure_derivative_gap(gap = 5)

# Norris-Williams with segment averaging for noise reduction
rec_nw <- recipe(water ~ ., data = meats) |>
  step_measure_input_wide(starts_with("x_"), location_values = example_grid) |>
  step_measure_derivative_gap(gap = 5, segment = 3)

plot_spectra(get_internal(rec_gap), "Gap Derivative (gap=5)")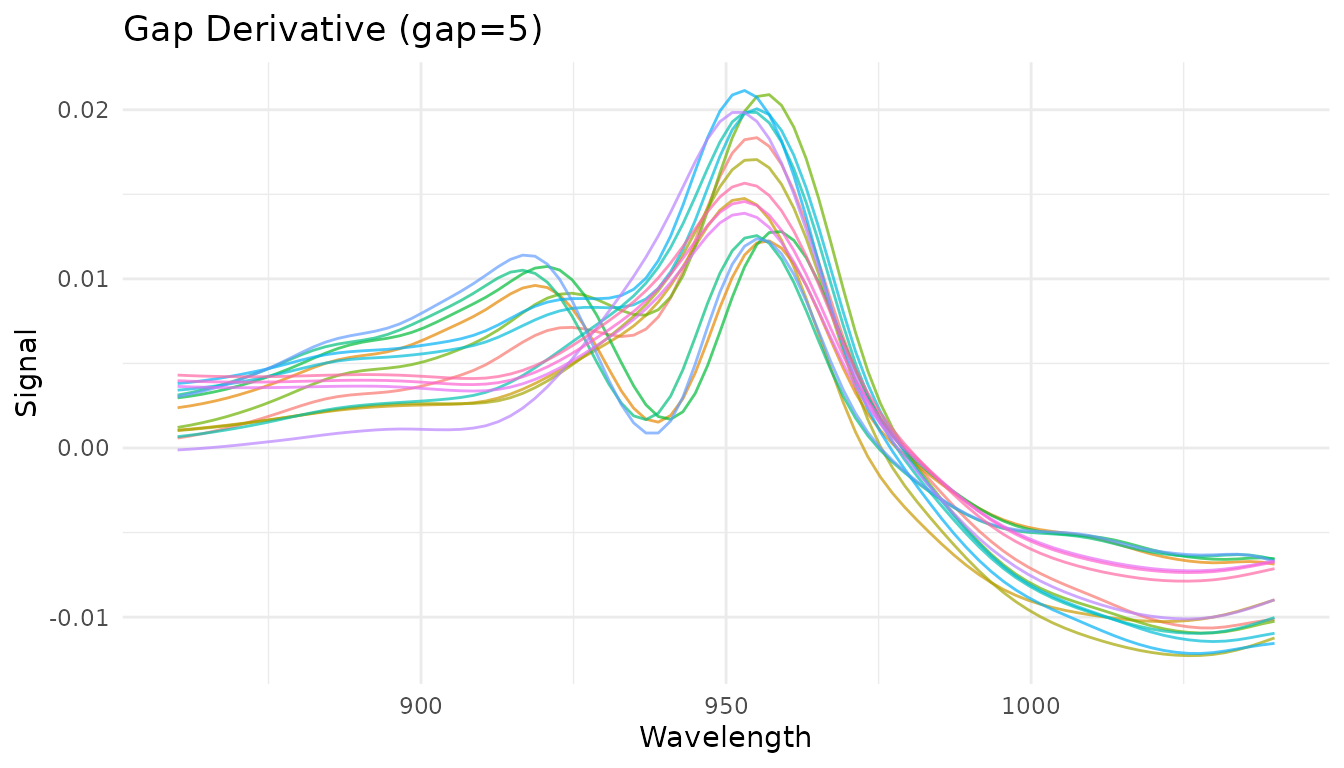
Gap-derivative output for the first 15 spectra using gap = 5. The plot shows transformed values at the locations retained by the step.
Both gap and segment parameters are tunable
with dials.
When to use each derivative method
| Method | Smoothing | Speed | Use when |
|---|---|---|---|
step_measure_savitzky_golay() |
Yes (polynomial) | Fast | Noisy data, need smoothing |
step_measure_derivative() |
No | Very fast | Clean data, unsmoothed derivative |
step_measure_derivative_gap() |
Optional (segment) | Fast | NIR chemometrics, configurable gap |
Region Operations
Region operations select, exclude, or resample portions of a measurement. They can focus an analysis on a region of interest or align data sampled on different grids.
Trimming to a range
step_measure_trim() keeps only measurements within a
specified x-axis range:
# Keep only example coordinates 880-1020
rec_trim <- recipe(water ~ ., data = meats) |>
  step_measure_input_wide(starts_with("x_"), location_values = example_grid) |>
  step_measure_trim(range = c(880, 1020))

trim_data <- get_internal(rec_trim)
plot_spectra(
  trim_data,
  "Trimmed to 880-1020 coordinate values",
  "Retained the selected interval"
)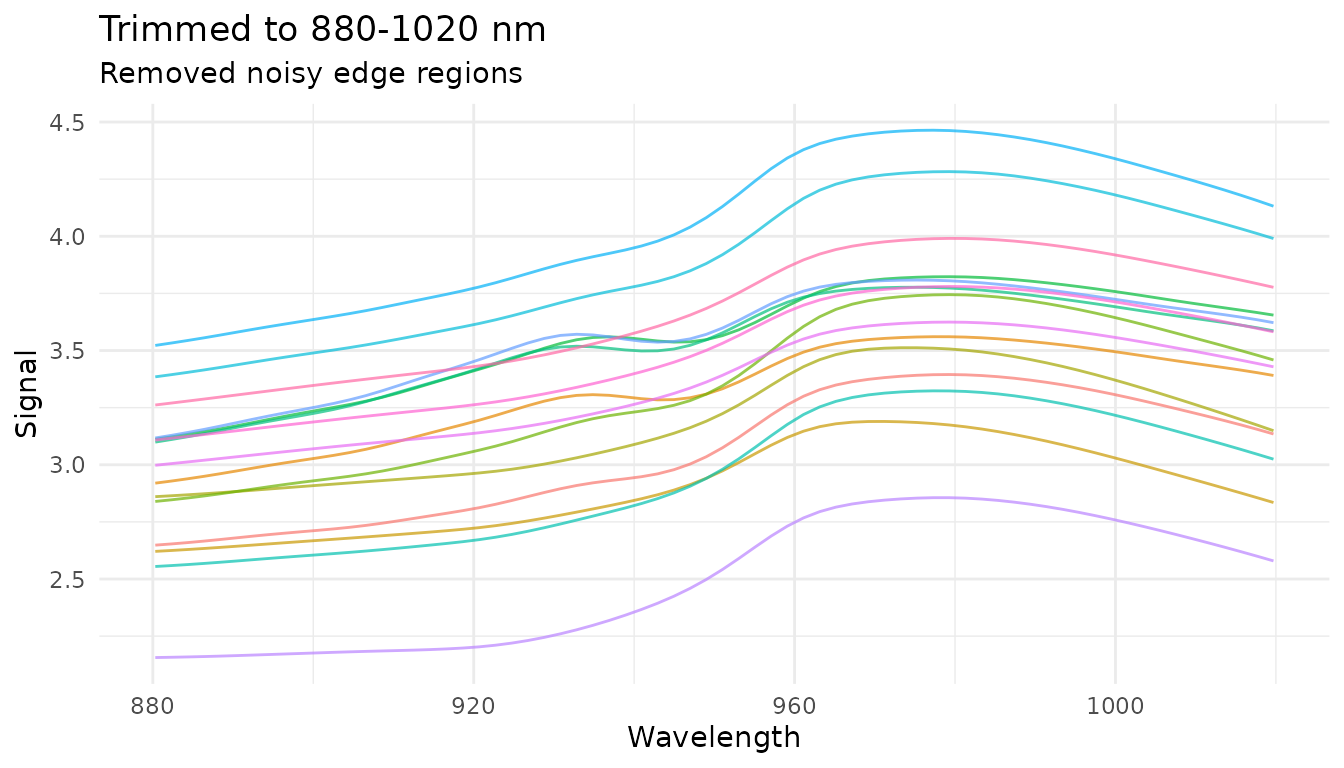
The first 15 spectra after trimming to example coordinates 880–1020. Points outside the selected interval are removed.
Common use cases: - Remove noisy regions at measurement edges - Focus on spectral region of interest - Define integration windows for chromatography
Excluding ranges
step_measure_exclude() removes measurements within one
or more specified ranges:
# Exclude two example example-coordinate intervals
rec_exclude <- recipe(water ~ ., data = meats) |>
  step_measure_input_wide(starts_with("x_"), location_values = example_grid) |>
  step_measure_exclude(ranges = list(c(920, 940), c(980, 1000)))

exclude_data <- get_internal(rec_exclude)
ggplot(exclude_data, aes(x = location, y = value, group = sample_id)) +
  geom_point(colour = "#286B8E", alpha = 0.55, size = 0.7) +
  labs(
    x = "Example coordinate",
    y = "Response (transformed scale)"
  ) +
  theme_measure()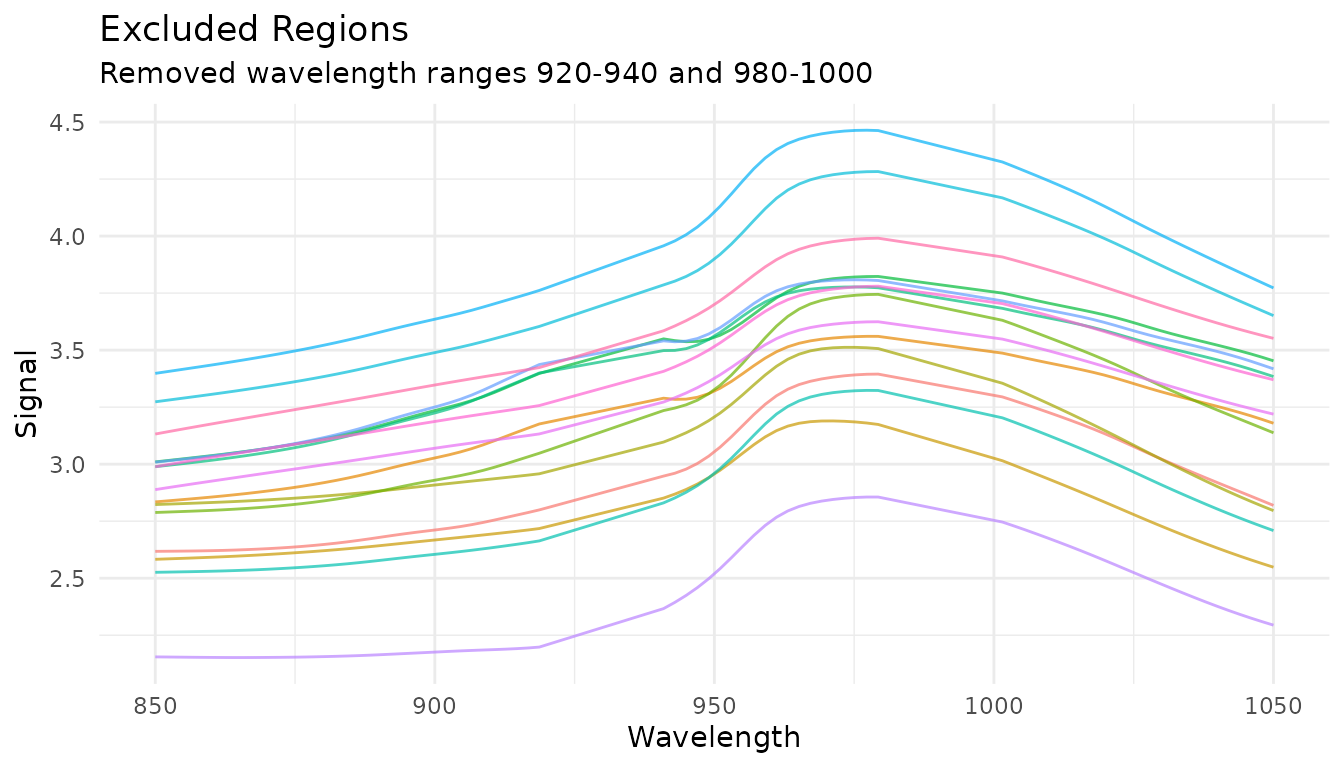
Retained observations from the first 15 spectra after excluding coordinate intervals 920–940 and 980–1000. Points show the measured locations; no line bridges the excluded intervals.
Common use cases: - Remove solvent peaks in chromatography - Exclude detector saturation regions - Remove known interference regions
Resampling to a new grid
step_measure_resample() interpolates measurements to a
new regular grid:
# Resample to 50 evenly spaced points
rec_resample <- recipe(water ~ ., data = meats) |>
  step_measure_input_wide(starts_with("x_"), location_values = example_grid) |>
  step_measure_resample(n = 50, method = "spline")

resample_data <- get_internal(rec_resample)
plot_spectra(resample_data, "Resampled to 50 Points",
             "Spline interpolation to regular grid")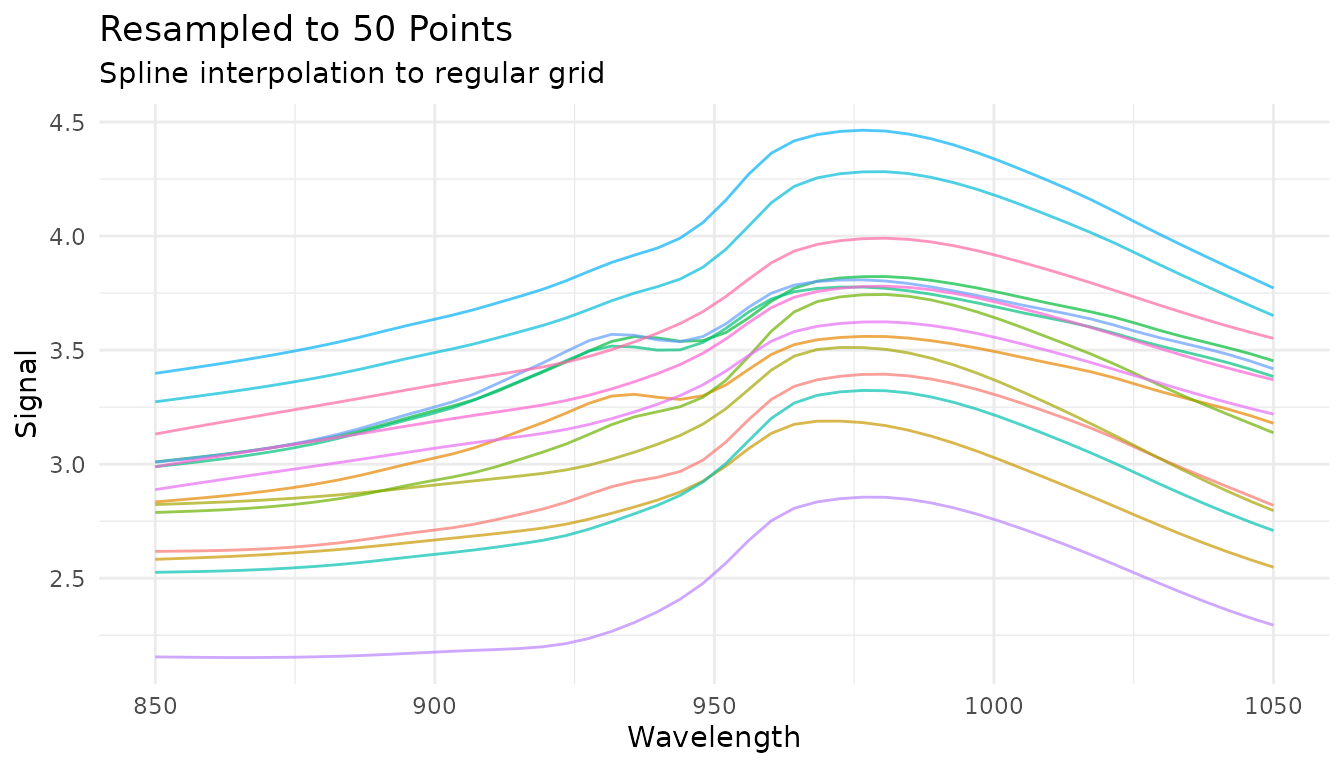
The first 15 spectra resampled to 50 points by spline interpolation over the input coordinate range.
You can also specify the spacing between points:
# Resample with spacing of 5 coordinate units
rec_resample_spacing <- recipe(water ~ ., data = meats) |>
  step_measure_input_wide(starts_with("x_"), location_values = example_grid) |>
  step_measure_resample(spacing = 5, method = "linear")

bake(prep(rec_resample_spacing), new_data = NULL)
#> # A tibble: 215 × 4
#>      fat protein water .measures
#>    <dbl>   <dbl> <dbl>    <meas>
#>  1  22.5    16.7  60.5  [41 × 2]
#>  2  40.1    13.5  46    [41 × 2]
#>  3   8.4    20.5  71    [41 × 2]
#>  4   5.9    20.7  72.8  [41 × 2]
#>  5  25.5    15.5  58.3  [41 × 2]
#>  6  42.7    13.7  44    [41 × 2]
#>  7  42.7    13.7  44    [41 × 2]
#>  8  10.6    19.3  69.3  [41 × 2]
#>  9  19.9    17.7  61.4  [41 × 2]
#> 10  19.9    17.7  61.4  [41 × 2]
#> # ℹ 205 more rows
Common use cases: - Align data from different instruments with different sampling rates - Reduce data density for faster processing - Ensure uniform spacing for methods that require it
Combining region operations
Region operations are often used together at the start of a preprocessing pipeline:
rec_regions <- recipe(water ~ ., data = meats) |>
  step_measure_input_wide(starts_with("x_"), location_values = example_grid) |>
  # First trim to region of interest
  step_measure_trim(range = c(860, 1040)) |>
  # Then resample to regular grid
  step_measure_resample(n = 50, method = "spline") |>
  # Now apply spectral preprocessing
  step_measure_savitzky_golay(window_side = 3, differentiation_order = 1) |>
  step_measure_snv()

region_pipeline_data <- get_internal(rec_regions)
plot_spectra(region_pipeline_data, "Region Selection + Preprocessing",
             "Trim → Resample → SG derivative → SNV")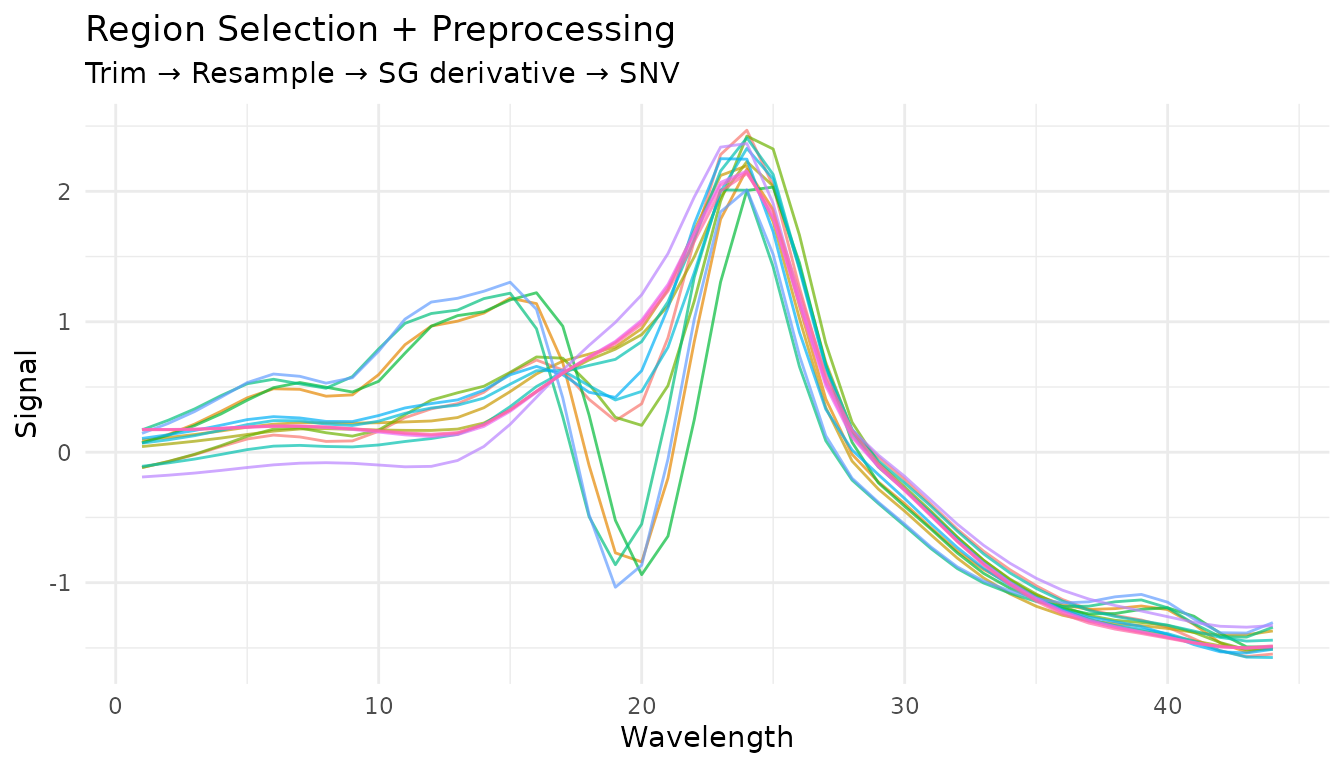
The first 15 spectra after trimming, spline resampling, first-derivative filtering, and SNV normalization. Each line is one sample after the full recipe.
Baseline Correction
Baseline correction estimates and removes a background signal from spectral data. The available algorithms use different assumptions and parameters.
Available methods
| Step | Algorithm | Best for |
|---|---|---|
step_measure_baseline_als() |
Asymmetric Least Squares | General purpose, smooth baselines |
step_measure_baseline_poly() |
Polynomial fitting | Simple, predictable baselines |
step_measure_baseline_rolling() |
Rolling ball | Wide peaks, chromatography |
step_measure_baseline_airpls() |
Adaptive Iteratively Reweighted PLS | Complex baselines |
step_measure_baseline_snip() |
SNIP algorithm | Spectroscopy with sharp peaks |
step_measure_detrend() |
Polynomial detrending | Linear/quadratic drift |
Rolling ball baseline
The rolling ball algorithm “rolls” a ball of specified radius under the spectrum to estimate the baseline:
rec_rolling <- recipe(water ~ ., data = meats) |>
  step_measure_input_wide(starts_with("x_"), location_values = example_grid) |>
  step_measure_baseline_rolling(window_size = 50)

rolling_data <- get_internal(rec_rolling)
plot_spectra(rolling_data, "Rolling Ball Baseline Correction",
             "Window size = 50")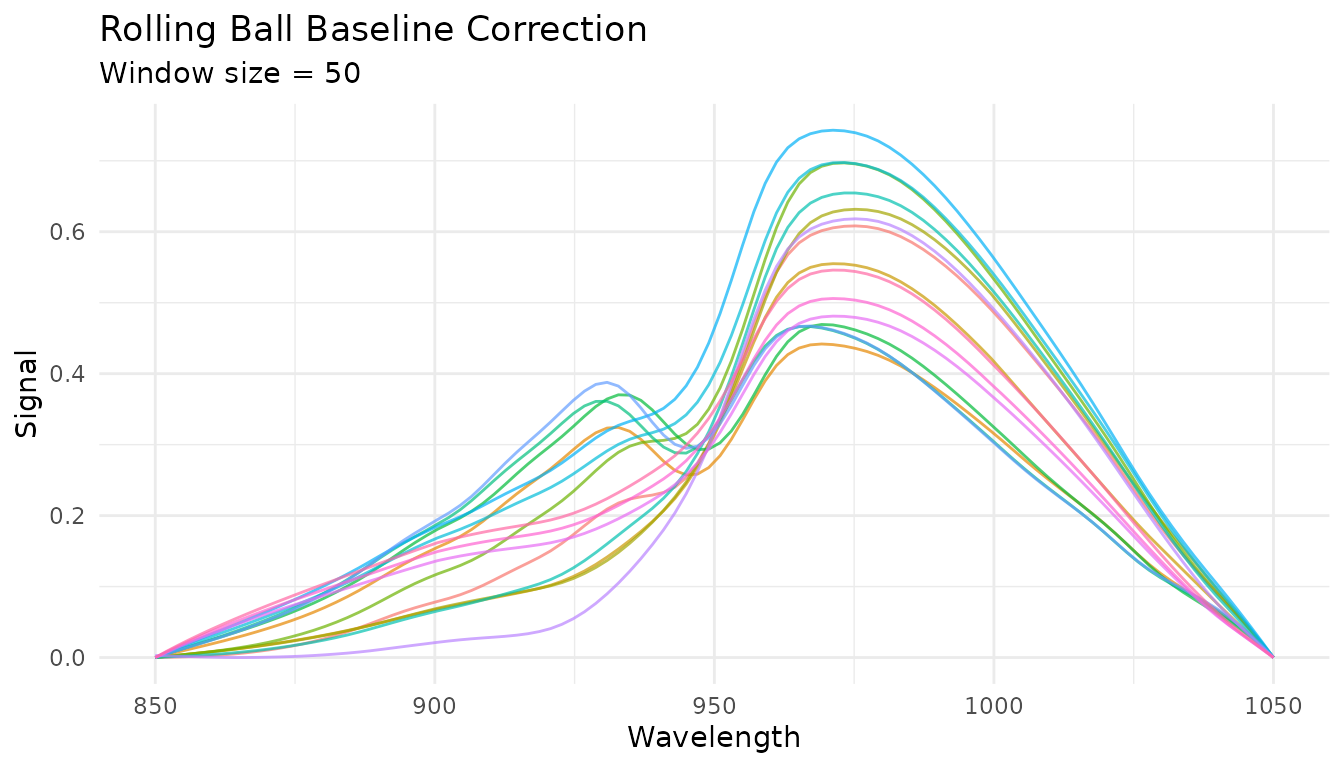
The first 15 spectra after the rolling-baseline step with window_size = 50. The plot displays corrected values; it does not include the estimated baseline curve.
Key parameters: - window_size: Diameter of the rolling
ball (larger = smoother baseline) - smoothing: Amount of
smoothing applied to the estimated baseline
airPLS baseline
Adaptive Iteratively Reweighted Penalized Least Squares adapts to complex, varying baselines:
rec_airpls <- recipe(water ~ ., data = meats) |>
  step_measure_input_wide(starts_with("x_"), location_values = example_grid) |>
  step_measure_baseline_airpls(lambda = 1e5, max_iter = 20)

airpls_data <- get_internal(rec_airpls)
plot_spectra(airpls_data, "airPLS Baseline Correction",
             "lambda = 1e5")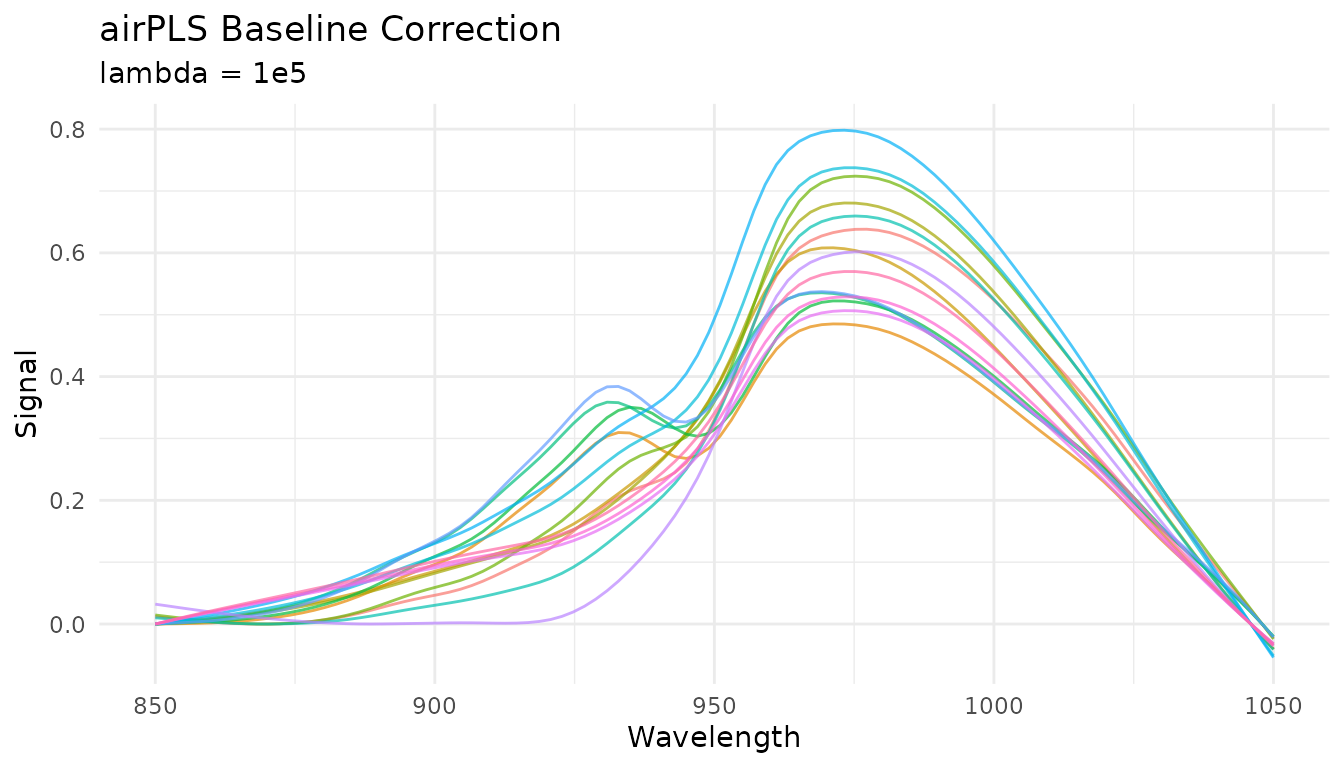
The first 15 spectra after airPLS baseline correction with lambda = 100,000 and at most 20 iterations. The plot displays corrected values without the estimated baseline curve.
The lambda parameter controls smoothness (larger =
smoother baseline) and is tunable with dials.
SNIP baseline
Statistics-sensitive Non-linear Iterative Peak-clipping (SNIP) is well-suited for spectroscopy with sharp peaks:
rec_snip <- recipe(water ~ ., data = meats) |>
  step_measure_input_wide(starts_with("x_"), location_values = example_grid) |>
  step_measure_baseline_snip(iterations = 30)

snip_data <- get_internal(rec_snip)
plot_spectra(snip_data, "SNIP Baseline Correction",
             "30 iterations, decreasing window")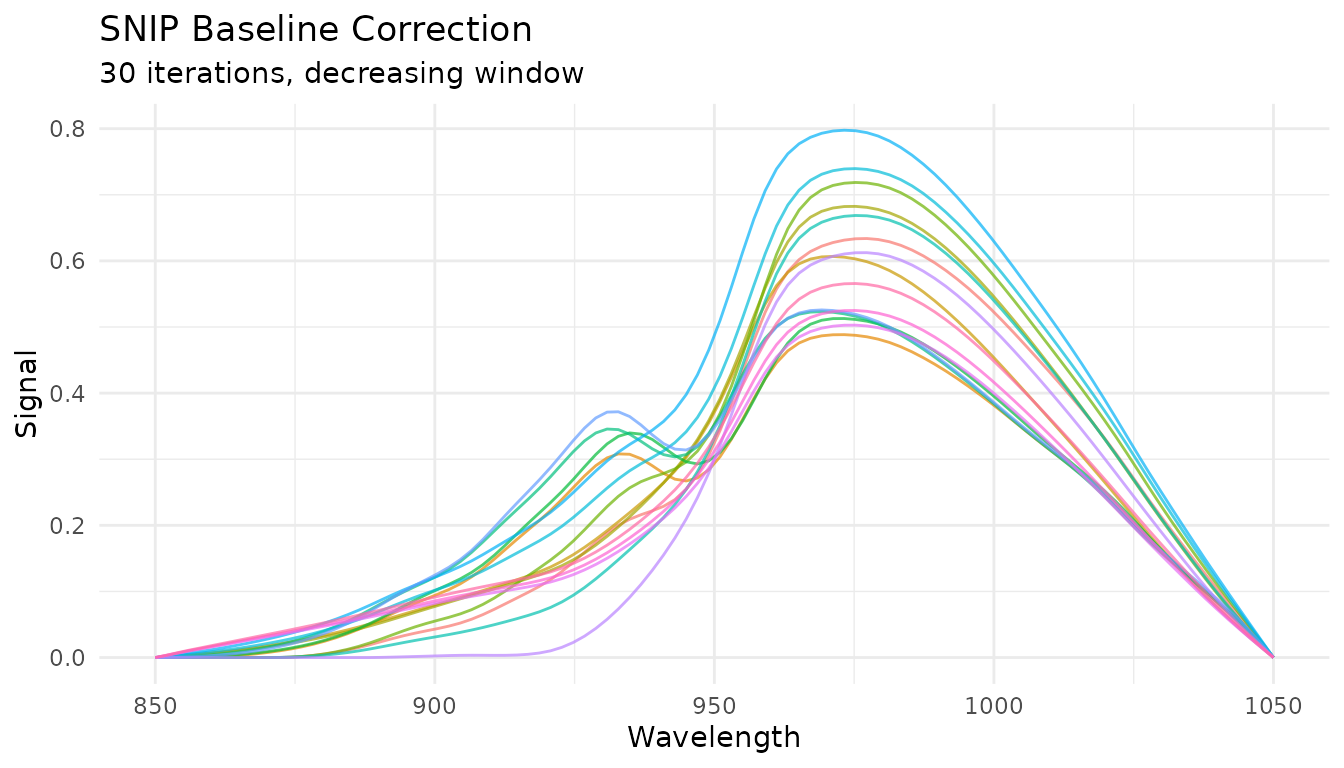
The first 15 spectra after SNIP correction with 30 iterations and a decreasing window. The plot displays corrected values without the estimated baseline curve.
Key parameters: - iterations: Number of clipping
iterations (more = more aggressive baseline removal) -
decreasing: Whether to decrease window size with iterations
(recommended for peaks)
Standard Normal Variate (SNV)
What it does
SNV normalizes each spectrum independently by centering and scaling:
where is the spectrum’s mean and is its standard deviation.
When to use it
- Remove multiplicative scatter effects
- Correct for path length variations
- Normalize spectra to similar magnitude
SNV is particularly effective for diffuse reflectance spectra where particle size causes scatter variations.
Example
rec_snv <- recipe(water ~ ., data = meats) |>
  step_measure_input_wide(starts_with("x_"), location_values = example_grid) |>
  step_measure_snv()

snv_data <- get_internal(rec_snv)
plot_spectra(snv_data, "After SNV Normalization", "Each spectrum has mean = 0 and sd = 1")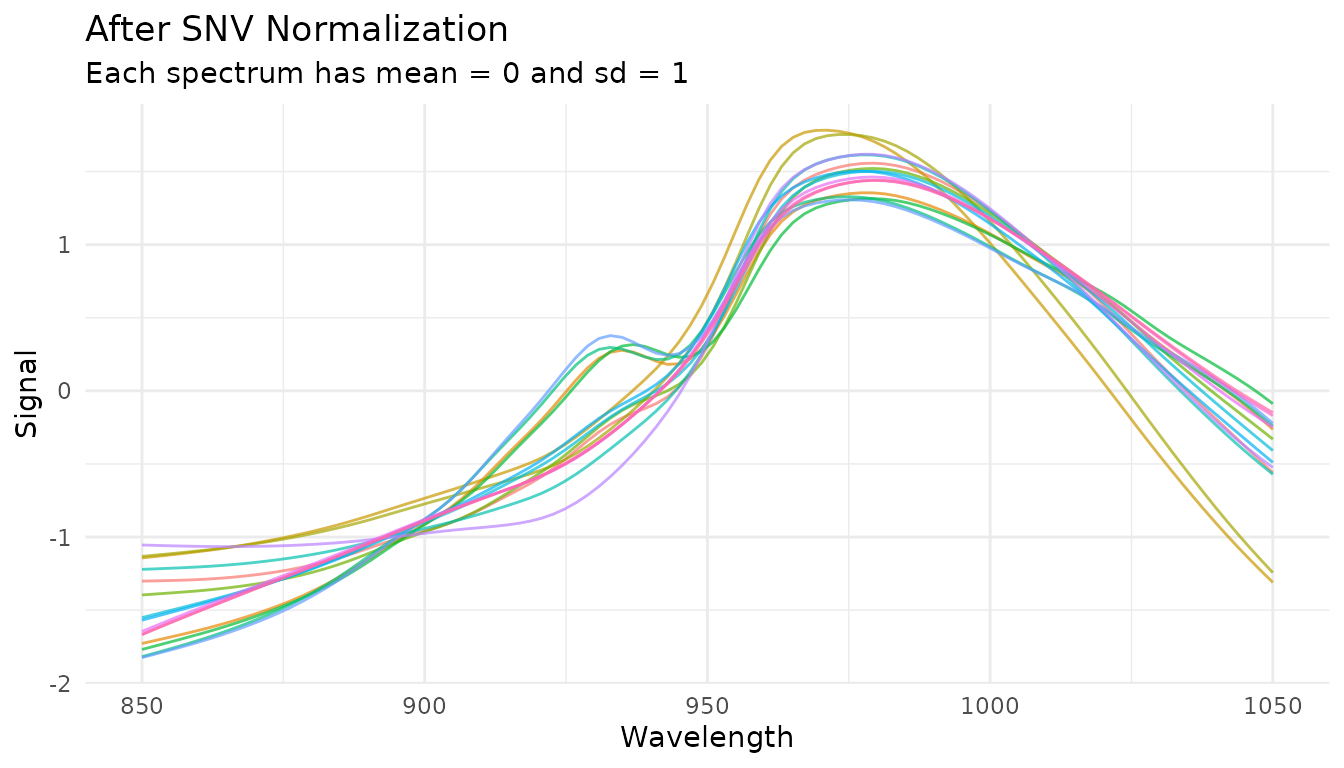
The first 15 spectra after sample-wise SNV normalization. Each spectrum is centered and scaled independently.
Combining with derivatives
SNV is often combined with Savitzky-Golay derivatives. The order matters:
# Derivative then SNV (more common)
rec_d1_snv <- recipe(water ~ ., data = meats) |>
  step_measure_input_wide(starts_with("x_"), location_values = example_grid) |>
  step_measure_savitzky_golay(window_side = 5, differentiation_order = 1) |>
  step_measure_snv()

plot_spectra(get_internal(rec_d1_snv), "1st Derivative + SNV",
             "Combined baseline removal and scatter correction")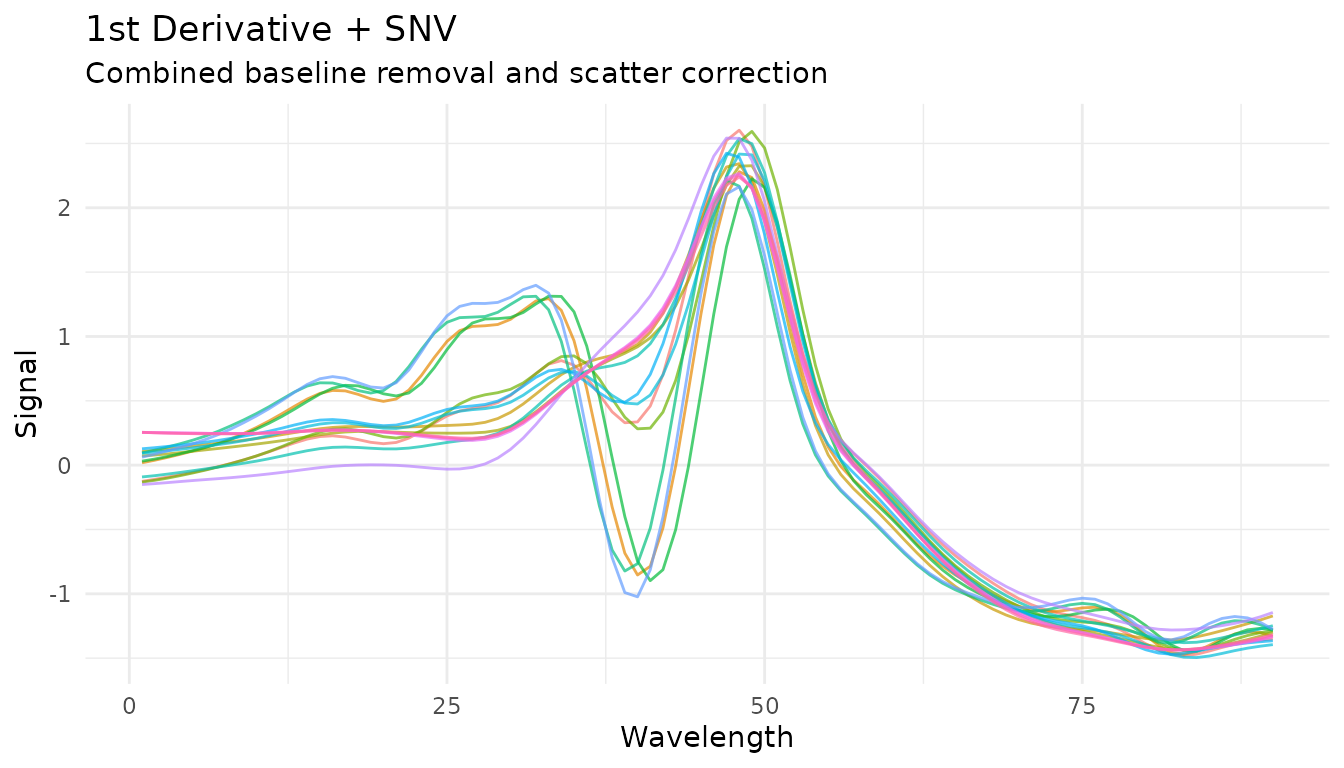
The first 15 spectra after a first Savitzky-Golay derivative followed by SNV normalization. This view shows the combined recipe output.
Multiplicative Scatter Correction (MSC)
What it does
MSC aligns each spectrum to a reference spectrum (typically the mean of all training spectra) by correcting for additive and multiplicative effects:
- Fit each spectrum to the reference :
- Correct:
When to use it
- Similar applications to SNV
- When you have a good reference spectrum
- Often slightly better than SNV for scatter correction
How it differs from SNV
- SNV: Each spectrum normalized independently (no reference needed)
- MSC: All spectra aligned to a common reference (learns reference during prep)
This means MSC is a trained step - it learns the reference spectrum from training data and applies the same reference to new data.
Example
rec_msc <- recipe(water ~ ., data = meats) |>
  step_measure_input_wide(starts_with("x_"), location_values = example_grid) |>
  step_measure_msc()

msc_data <- get_internal(rec_msc)
plot_spectra(msc_data, "After MSC", "Spectra aligned to mean reference")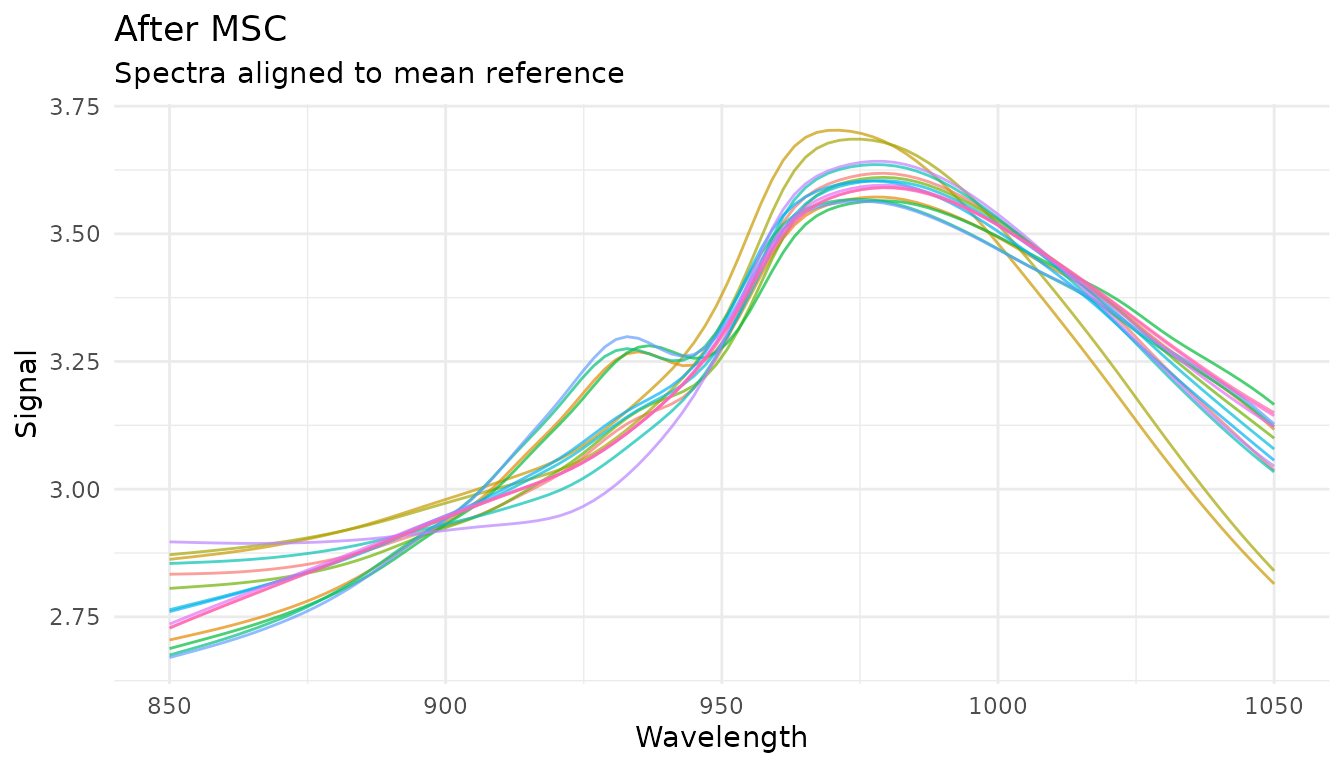
The first 15 spectra after MSC correction using the mean reference learned during recipe preparation.
Comparing SNV and MSC
scatter_comparison <- dplyr::bind_rows(
  get_internal(rec_snv) |> mutate(method = "SNV"),
  get_internal(rec_msc) |> mutate(method = "MSC")
)
scatter_comparison$method <- factor(
  scatter_comparison$method,
  levels = c("SNV", "MSC")
)

ggplot(
  scatter_comparison,
  aes(x = location, y = value, group = sample_id)
) +
  geom_line(colour = "#286B8E", alpha = 0.55, linewidth = 0.45) +
  facet_wrap(~method, ncol = 1, scales = "free_y") +
  labs(
    x = "Example coordinate",
    y = "Response (transformed scale)"
  ) +
  theme_measure()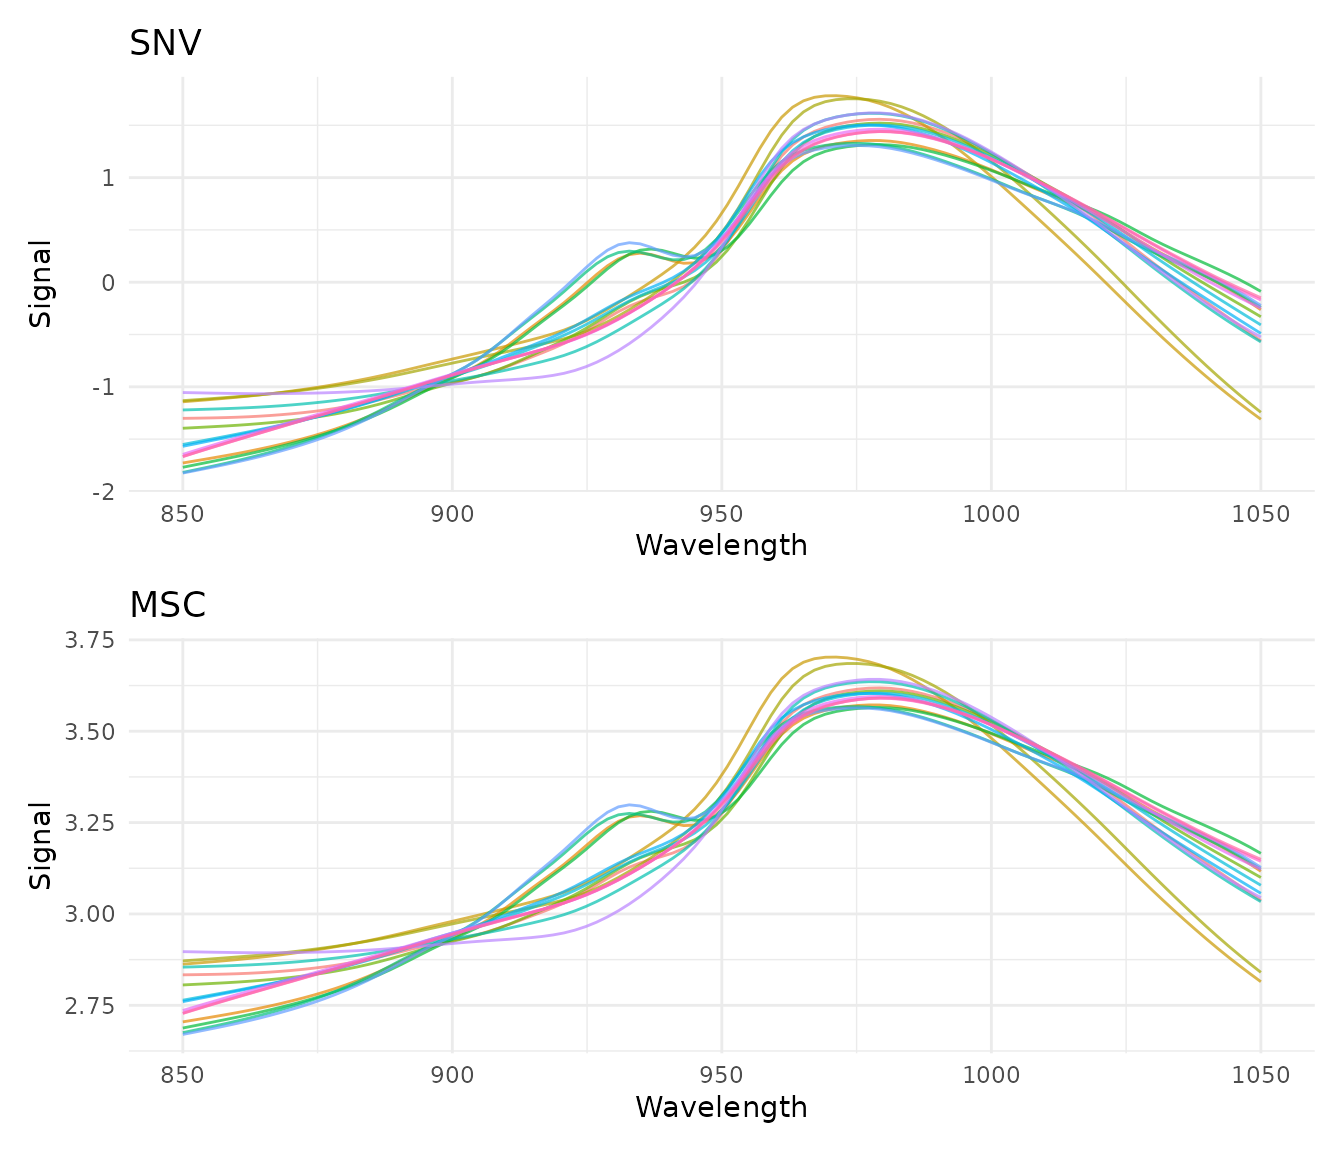
Two panels compare SNV and MSC outputs for the first 15 spectra. Both panels use the same example coordinates; response scales are free by panel.
The panels show the output profiles for this dataset. To choose between SNV and MSC for a modeling workflow, compare them using validation data kept separate from recipe preparation.
Extended Scatter Correction
For more complex scatter effects, measure provides advanced scatter correction methods.
Extended MSC (EMSC)
EMSC extends standard MSC by modeling wavelength-dependent scatter effects using polynomial terms:
rec_emsc <- recipe(water ~ ., data = meats) |>
  step_measure_input_wide(starts_with("x_"), location_values = example_grid) |>
  step_measure_emsc(degree = 2)

emsc_data <- get_internal(rec_emsc)
plot_spectra(emsc_data, "After EMSC (degree=2)", "Wavelength-dependent scatter correction")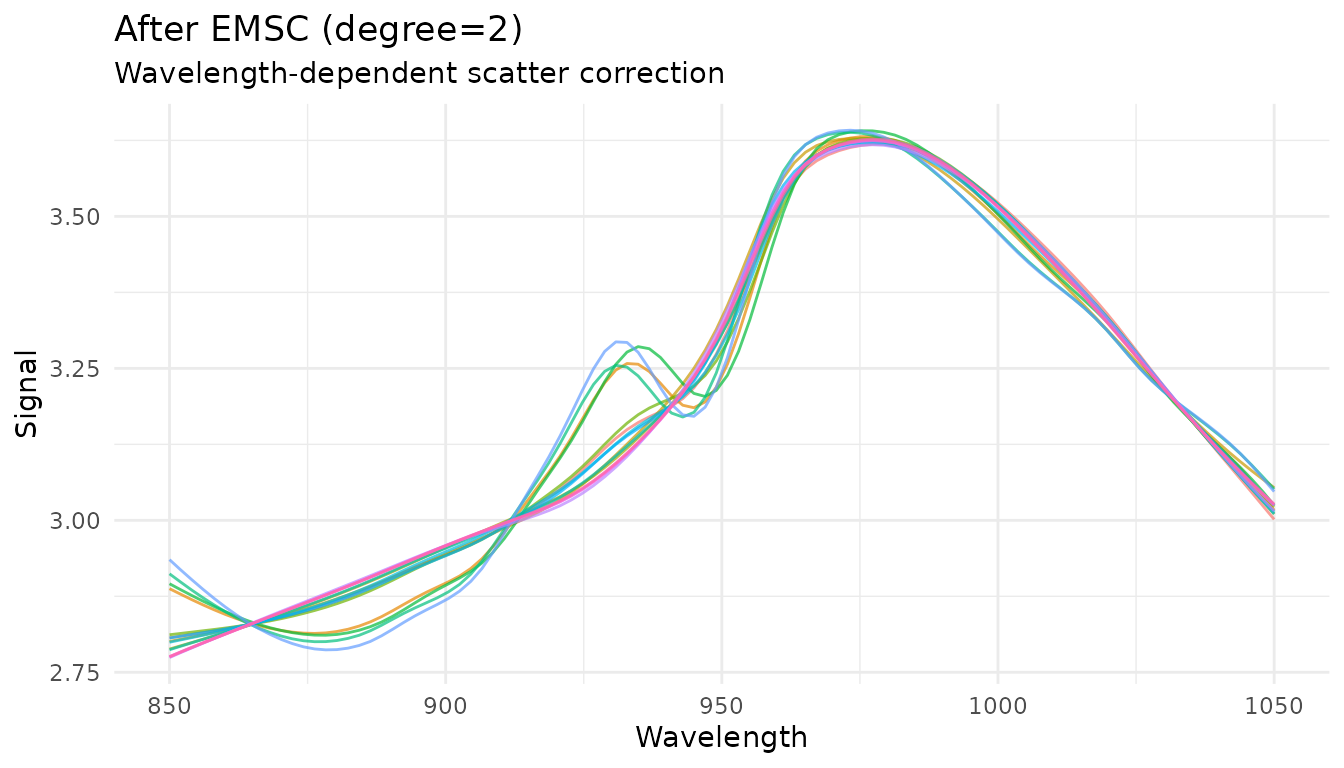
The first 15 spectra after EMSC with polynomial degree 2. The plot displays corrected values rather than the fitted polynomial terms.
The degree parameter controls the polynomial order for
wavelength terms (0 = standard MSC, higher = more flexibility). This
parameter is tunable.
Orthogonal Signal Correction (OSC)
OSC removes variation in spectra that is orthogonal (uncorrelated) to the response variable. This is a supervised technique that requires outcome variables:
rec_osc <- recipe(water ~ ., data = meats) |>
  step_measure_input_wide(starts_with("x_"), location_values = example_grid) |>
  step_measure_osc(n_components = 2)

osc_data <- get_internal(rec_osc)
plot_spectra(osc_data, "After OSC", "Removed 2 orthogonal components")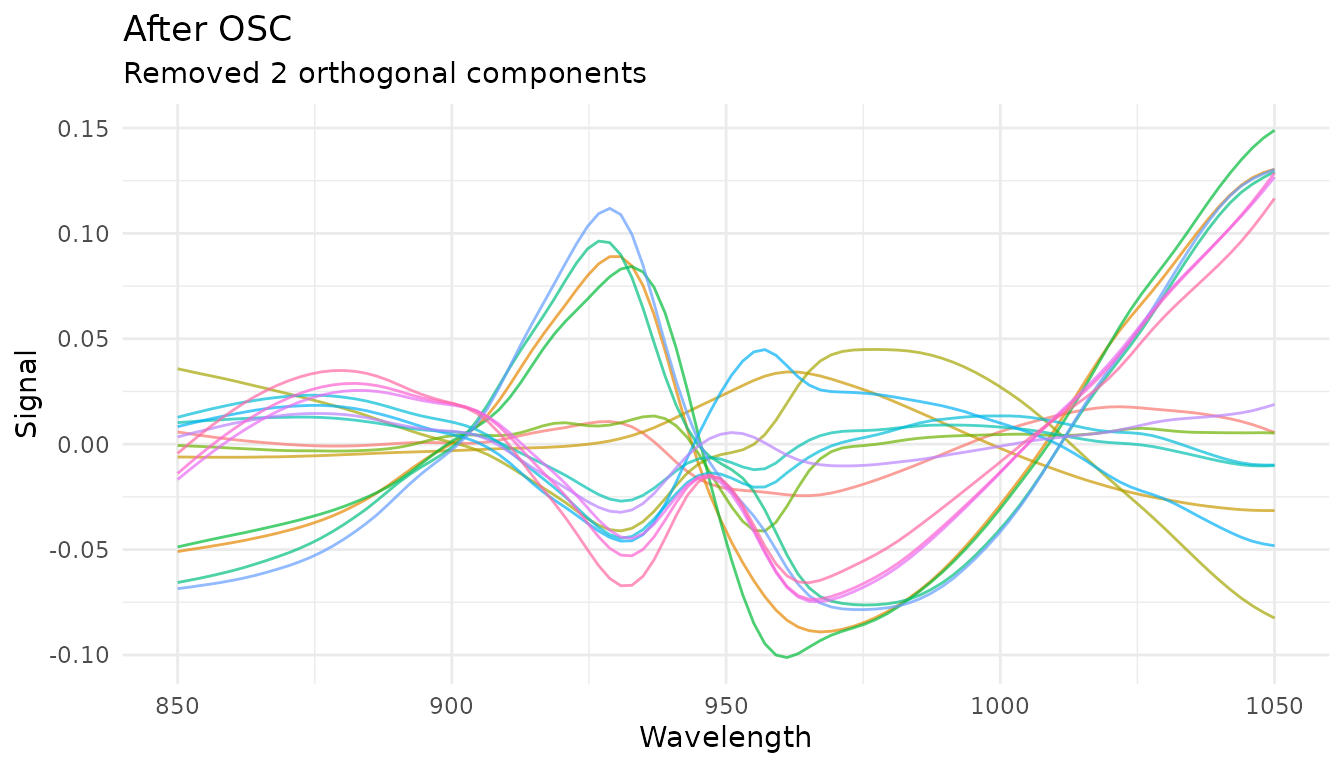
The first 15 spectra after OSC removes two components orthogonal to the response in the fitted recipe. The plot displays the returned spectra.
OSC automatically detects outcome variables from the recipe formula.
The n_components parameter controls how many orthogonal
components to remove and is tunable.
When to use EMSC vs OSC: - EMSC: Physical scatter effects that vary with wavelength - OSC: Systematic variation unrelated to your response (supervised)
Feature Engineering
Feature engineering steps extract scalar features from spectral data, creating new predictor columns useful for modeling.
Region Integration
step_measure_integrals() calculates integrated areas for
specified regions, useful for quantifying peak areas:
rec_integrals <- recipe(water ~ ., data = meats) |>
  step_measure_input_wide(starts_with("x_"), location_values = example_grid) |>
  step_measure_integrals(
    regions = list(
      region_a = c(870, 920),
      region_b = c(950, 1000)
    ),
    method = "trapezoid"
  )

# View extracted features
bake(prep(rec_integrals), new_data = NULL) |>
  select(starts_with("integral_")) |>
  head()
#> # A tibble: 6 × 2
#>   integral_region_a integral_region_b
#>               <dbl>             <dbl>
#> 1              131.              161.
#> 2              146.              170.
#> 3              129.              152.
#> 4              140.              167.
#> 5              141.              177.
#> 6              155.              183.
Region Ratios
step_measure_ratios() calculates ratios between
integrated regions, often used for internal calibration:
rec_ratios <- recipe(water ~ ., data = meats) |>
  step_measure_input_wide(starts_with("x_"), location_values = example_grid) |>
  step_measure_ratios(
    numerator = c(870, 920),
    denominator = c(950, 1000),
    name = "peak_ratio"
  )

bake(prep(rec_ratios), new_data = NULL) |>
  select(peak_ratio) |>
  head()
#> # A tibble: 6 × 1
#>   peak_ratio
#>        <dbl>
#> 1      0.810
#> 2      0.855
#> 3      0.849
#> 4      0.841
#> 5      0.795
#> 6      0.851
Statistical Moments
step_measure_moments() extracts statistical moments from
spectra:
rec_moments <- recipe(water ~ ., data = meats) |>
  step_measure_input_wide(starts_with("x_"), location_values = example_grid) |>
  step_measure_moments(moments = c("mean", "sd", "skewness", "kurtosis"))

bake(prep(rec_moments), new_data = NULL) |>
  select(starts_with("moment_")) |>
  head()
#> # A tibble: 6 × 4
#>   moment_mean moment_sd moment_skewness moment_kurtosis
#>         <dbl>     <dbl>           <dbl>           <dbl>
#> 1        2.97     0.270           0.222           -1.38
#> 2        3.24     0.234          -0.311           -1.19
#> 3        2.82     0.206           0.536           -1.15
#> 4        3.09     0.238           0.540           -1.19
#> 5        3.25     0.326           0.102           -1.37
#> 6        3.48     0.262          -0.387           -1.17
Spectral Binning
step_measure_bin() reduces spectral resolution by
averaging or summing bins. This can reduce noise and dimensionality:
rec_bin <- recipe(water ~ ., data = meats) |>
  step_measure_input_wide(starts_with("x_"), location_values = example_grid) |>
  step_measure_bin(n_bins = 20, method = "mean")

bin_data <- get_internal(rec_bin)
plot_spectra(bin_data, "Binned to 20 Points", "Reduced dimensionality")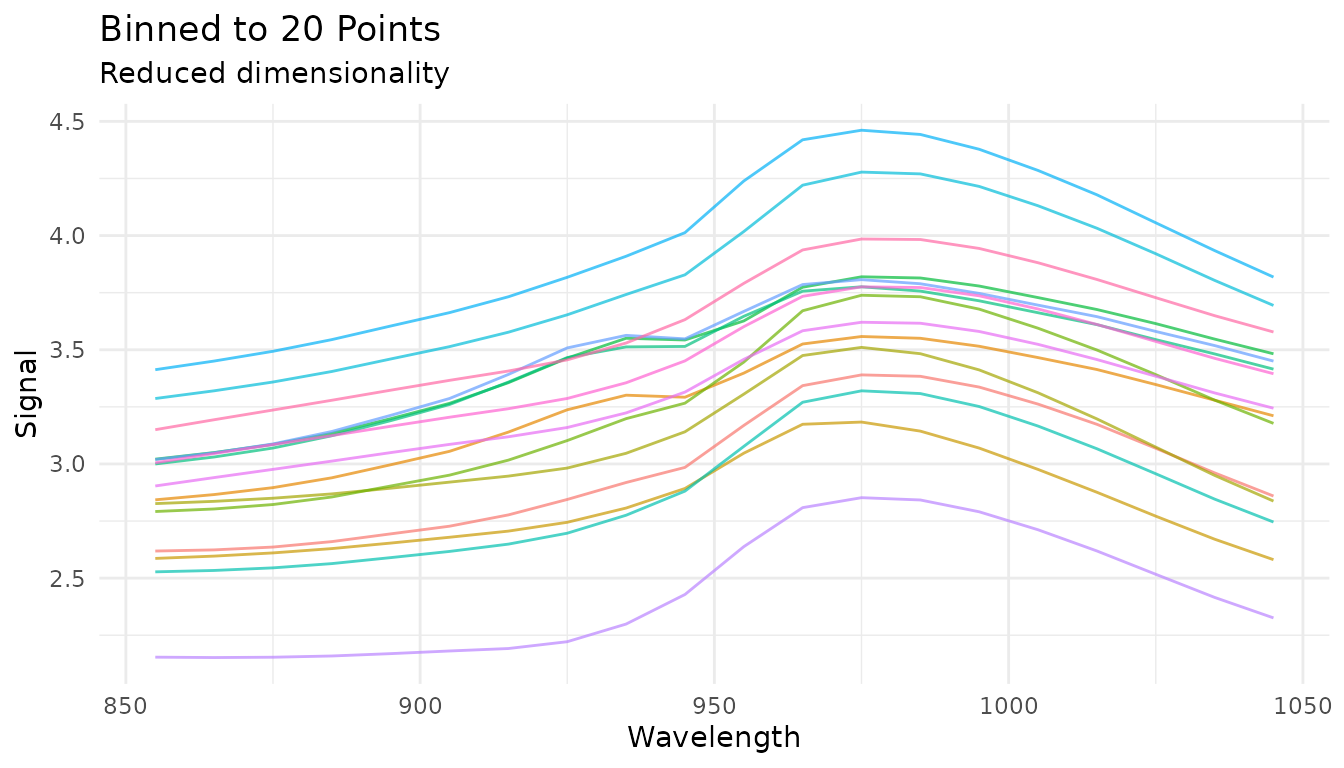
The first 15 spectra after averaging into 20 bins. The number of locations is reduced from the 100-point input grid.
You can use n_bins or a numeric bin_width;
the step uses one fixed value when preparing a recipe:
rec_bin_width <- recipe(water ~ ., data = meats) |>
  step_measure_input_wide(starts_with("x_"), location_values = example_grid) |>
  step_measure_bin(bin_width = 10)

bake(prep(rec_bin_width), new_data = NULL)
#> # A tibble: 215 × 4
#>      fat protein water .measures
#>    <dbl>   <dbl> <dbl>    <meas>
#>  1  22.5    16.7  60.5  [20 × 2]
#>  2  40.1    13.5  46    [20 × 2]
#>  3   8.4    20.5  71    [20 × 2]
#>  4   5.9    20.7  72.8  [20 × 2]
#>  5  25.5    15.5  58.3  [20 × 2]
#>  6  42.7    13.7  44    [20 × 2]
#>  7  42.7    13.7  44    [20 × 2]
#>  8  10.6    19.3  69.3  [20 × 2]
#>  9  19.9    17.7  61.4  [20 × 2]
#> 10  19.9    17.7  61.4  [20 × 2]
#> # ℹ 205 more rows
Sample-wise Normalization
The measure package provides several sample-wise normalization methods that normalize each spectrum independently. Unlike SNV/MSC which address scatter, these methods adjust for differences in total signal intensity.
Available methods
| Step | Formula | Use case |
|---|---|---|
step_measure_normalize_sum() |
Total intensity normalization | |
step_measure_normalize_max() |
Peak-focused analysis | |
step_measure_normalize_range() |
Scale to 0-1 range | |
step_measure_normalize_vector() |
L2/Euclidean normalization | |
step_measure_normalize_auc() |
Chromatography (area under curve) | |
step_measure_normalize_peak() |
Internal standard normalization |
Sum normalization
Divides each spectrum by its total intensity. After transformation, all spectra sum to 1:
rec_norm_sum <- recipe(water ~ ., data = meats) |>
  step_measure_input_wide(starts_with("x_"), location_values = example_grid) |>
  step_measure_normalize_sum()

plot_spectra(get_internal(rec_norm_sum), "Sum Normalized",
             "Each spectrum sums to 1")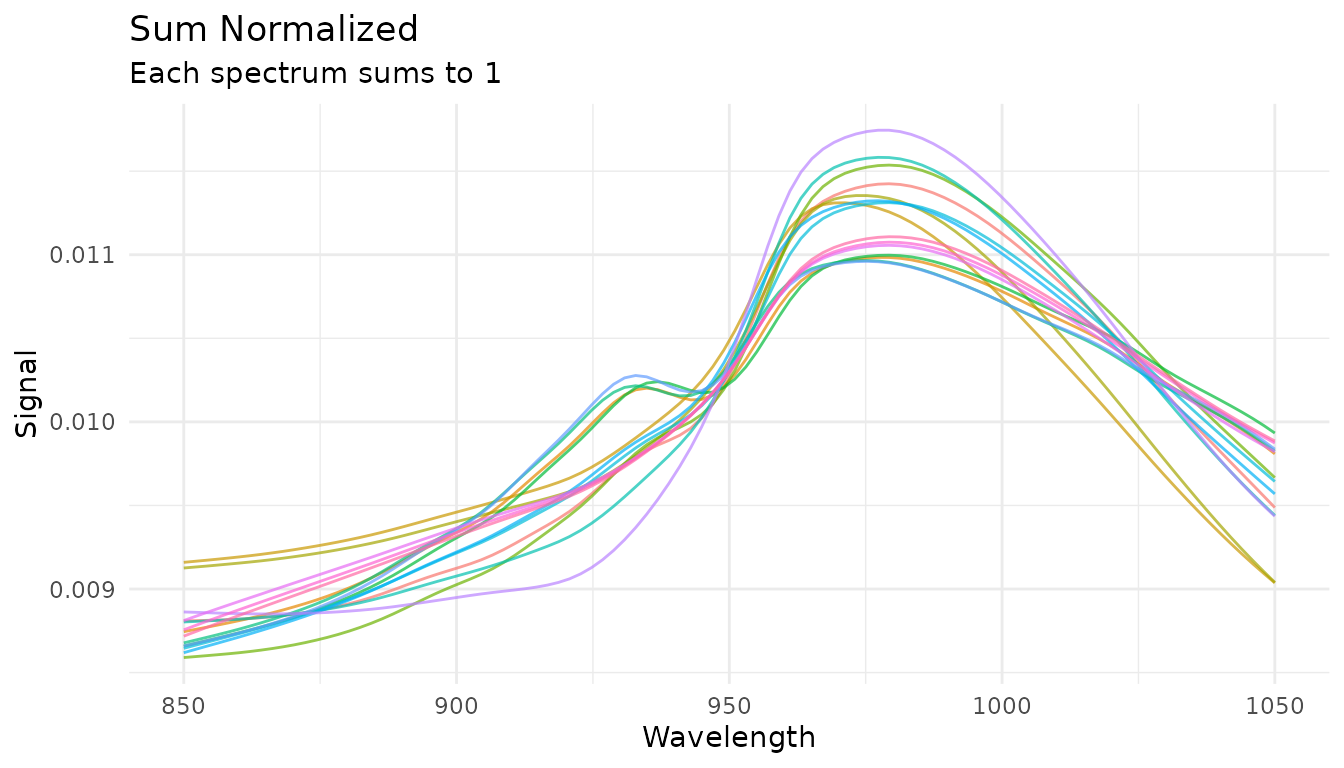
The first 15 spectra after each profile is divided by its sum. This normalization makes the sum of each nonzero profile equal to one.
Max normalization
Divides each spectrum by its maximum value, useful for peak-focused analysis:
rec_norm_max <- recipe(water ~ ., data = meats) |>
  step_measure_input_wide(starts_with("x_"), location_values = example_grid) |>
  step_measure_normalize_max()

plot_spectra(get_internal(rec_norm_max), "Max Normalized",
             "Each spectrum has maximum = 1")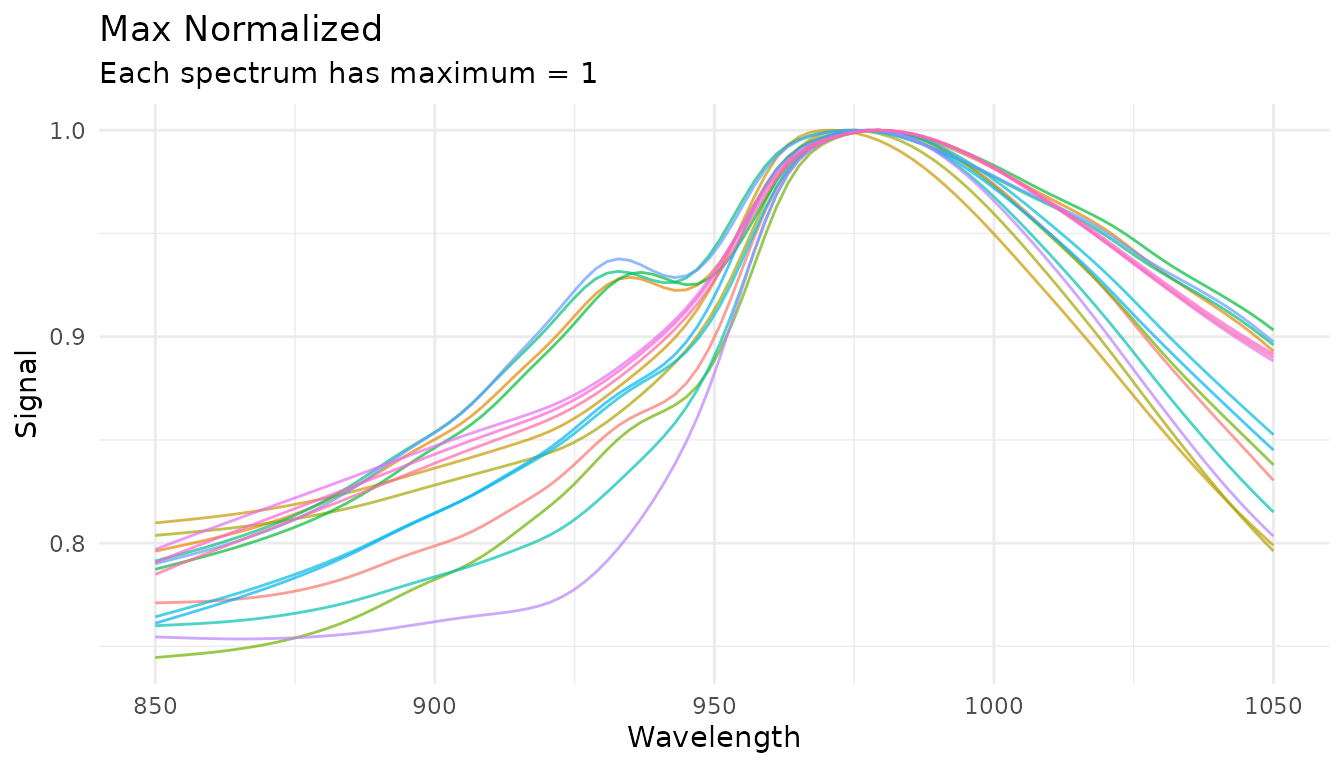
The first 15 spectra after each profile is divided by its maximum value. The maximum of each nonzero profile is one.
Peak region normalization (tunable)
When you have an internal standard at a known location, use
step_measure_normalize_peak() to normalize by a specific
region:
rec_norm_peak <- recipe(water ~ ., data = meats) |>
  step_measure_input_wide(starts_with("x_"), location_values = example_grid) |>
  step_measure_normalize_peak(
    location_min = 900,
    location_max = 950,
    method = "mean"  # or "max" or "integral"
  )

plot_spectra(get_internal(rec_norm_peak), "Peak Region Normalized",
             "Normalized by mean of region 900-950")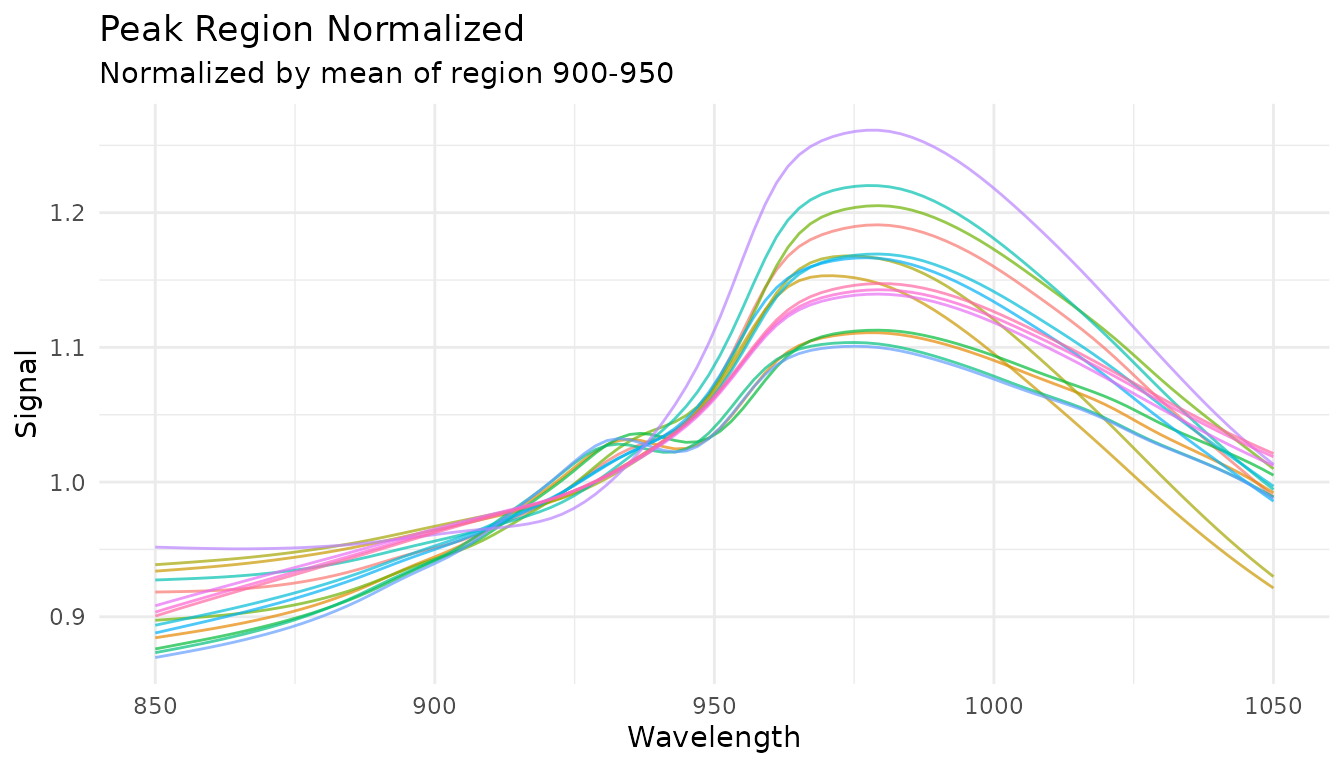
The first 15 spectra normalized by the mean response within coordinate values 900–950. The selected interval defines the denominator for each sample.
The location_min and location_max
parameters are tunable:
rec_tunable_peak <- recipe(water ~ ., data = meats) |>
  step_measure_input_wide(starts_with("x_"), location_values = example_grid) |>
  step_measure_normalize_peak(
    location_min = tune::tune(),
    location_max = tune::tune(),
    method = "mean"
  ) |>
  step_measure_output_wide()

tune::tunable(rec_tunable_peak)
#> # A tibble: 2 × 5
#>   name         call_info        source component                   component_id
#>   <chr>        <list>           <chr>  <chr>                       <chr>
#> 1 location_min <named list [2]> recipe step_measure_normalize_peak measure_norm…
#> 2 location_max <named list [2]> recipe step_measure_normalize_peak measure_norm…
Variable-wise Scaling
While sample-wise methods normalize each spectrum independently, variable-wise scaling operates across samples at each measurement location. These methods learn statistics from training data and apply them consistently to new data.
When to use variable-wise scaling
- Before PCA/PLS: Centering is essential; scaling equalizes variable importance
- When variables have different scales: Auto-scaling gives equal weight to all locations
- For metabolomics data: Pareto scaling is common practice
Mean centering
step_measure_center() subtracts the column mean at each
location:
rec_center <- recipe(water ~ ., data = meats) |>
  step_measure_input_wide(starts_with("x_"), location_values = example_grid) |>
  step_measure_center()

center_data <- get_internal(rec_center)
plot_spectra(center_data, "Mean Centered",
             "Column means are zero")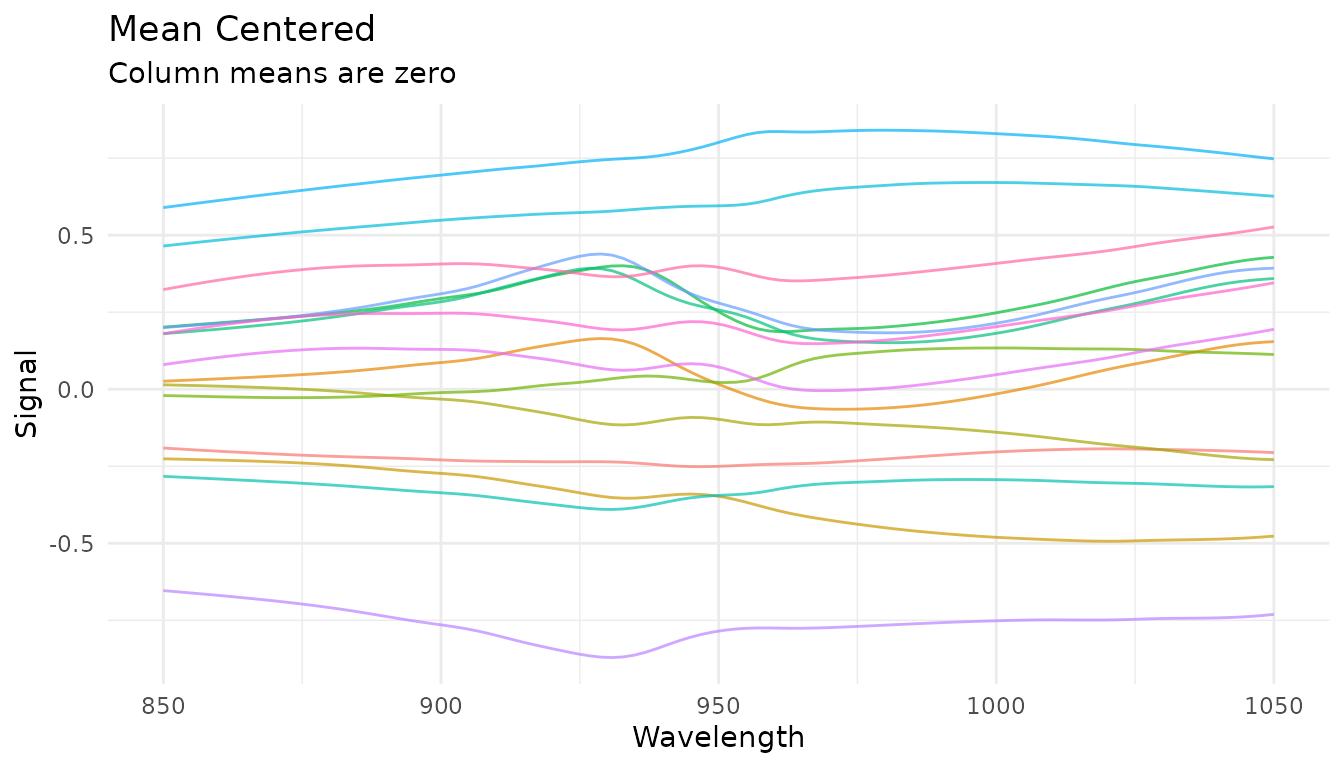
The first 15 spectra after subtracting the training-data mean at each location. The plot shows centered responses across samples.
Auto-scaling (z-score)
step_measure_scale_auto() centers and scales to unit
variance at each location:
rec_auto <- recipe(water ~ ., data = meats) |>
  step_measure_input_wide(starts_with("x_"), location_values = example_grid) |>
  step_measure_scale_auto()

auto_data <- get_internal(rec_auto)
plot_spectra(auto_data, "Auto-Scaled (Z-Score)",
             "Column means = 0, SDs = 1")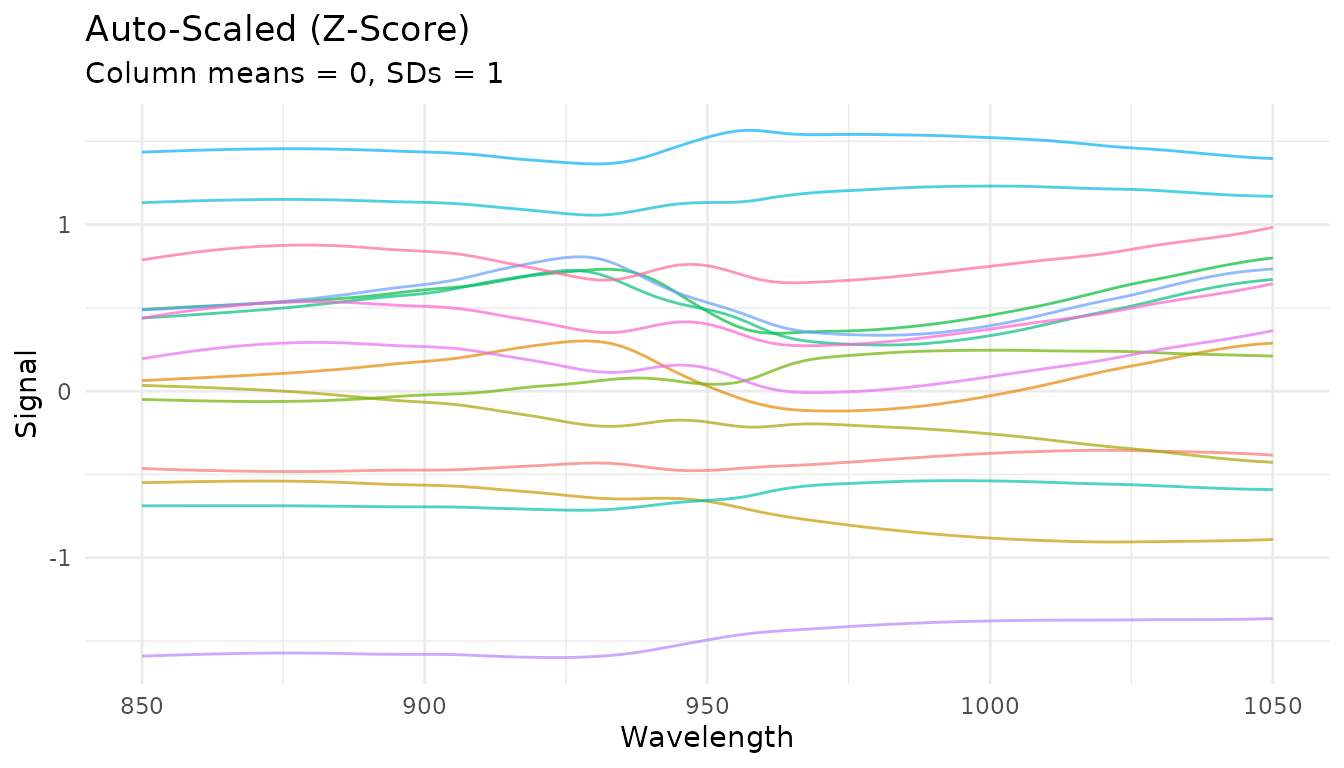
The first 15 spectra after variable-wise auto-scaling. The training mean and standard deviation at each location are used to transform responses.
Pareto scaling
step_measure_scale_pareto() divides by the square root
of the standard deviation - a compromise between no scaling and
auto-scaling:
rec_pareto <- recipe(water ~ ., data = meats) |>
  step_measure_input_wide(starts_with("x_"), location_values = example_grid) |>
  step_measure_scale_pareto()

pareto_data <- get_internal(rec_pareto)
plot_spectra(pareto_data, "Pareto Scaled",
             "Centered and scaled by square root of location-wise SD")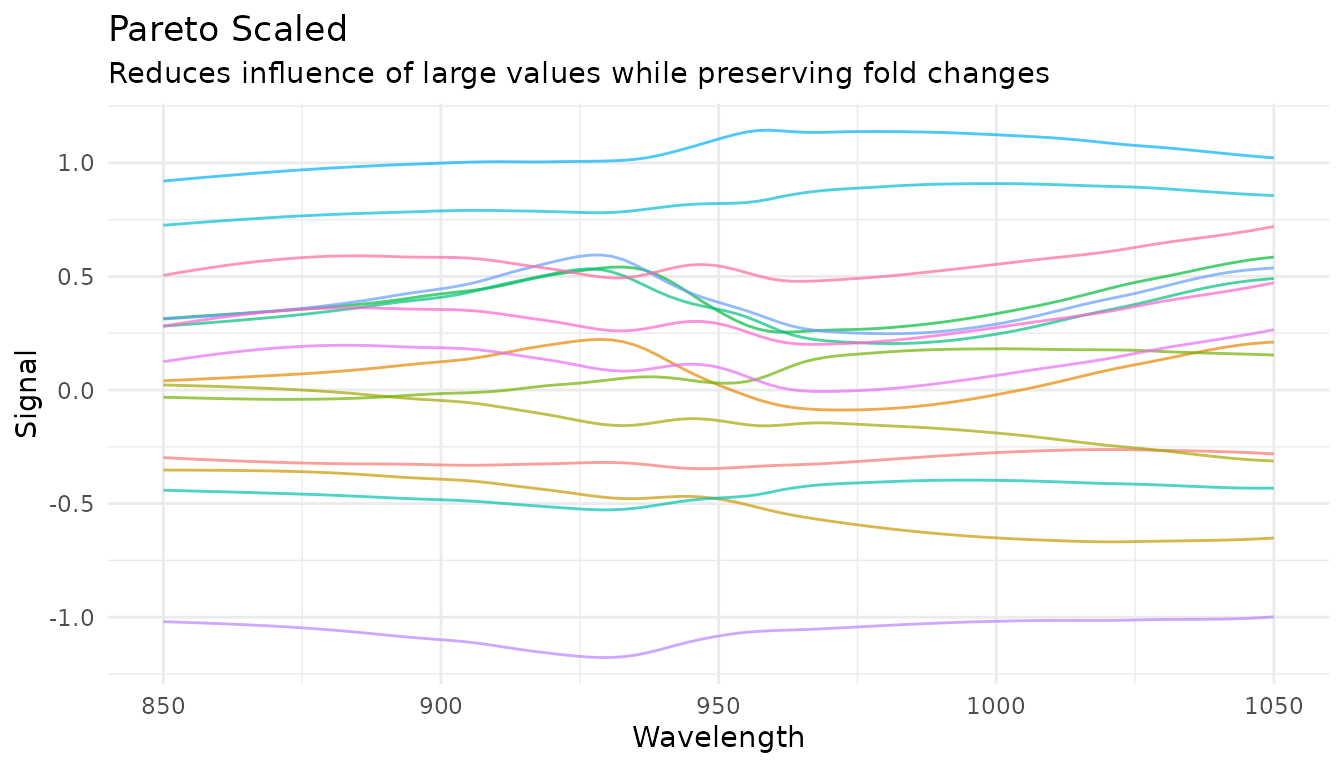
The first 15 spectra after Pareto scaling, which centers by the training mean and scales by the square root of the location-wise standard deviation.
Comparing scaling methods
scaling_comparison <- dplyr::bind_rows(
  raw_data |> mutate(method = "Raw absorbance"),
  center_data |> mutate(method = "Centered"),
  auto_data |> mutate(method = "Auto-scaled"),
  pareto_data |> mutate(method = "Pareto-scaled")
)
scaling_comparison$method <- factor(
  scaling_comparison$method,
  levels = c("Raw absorbance", "Centered", "Auto-scaled", "Pareto-scaled")
)

ggplot(
  scaling_comparison,
  aes(x = location, y = value, group = sample_id)
) +
  geom_line(colour = "#286B8E", alpha = 0.55, linewidth = 0.45) +
  facet_wrap(~method, ncol = 2, scales = "free_y") +
  labs(
    x = "Example coordinate",
    y = "Response (method scale)"
  ) +
  theme_measure()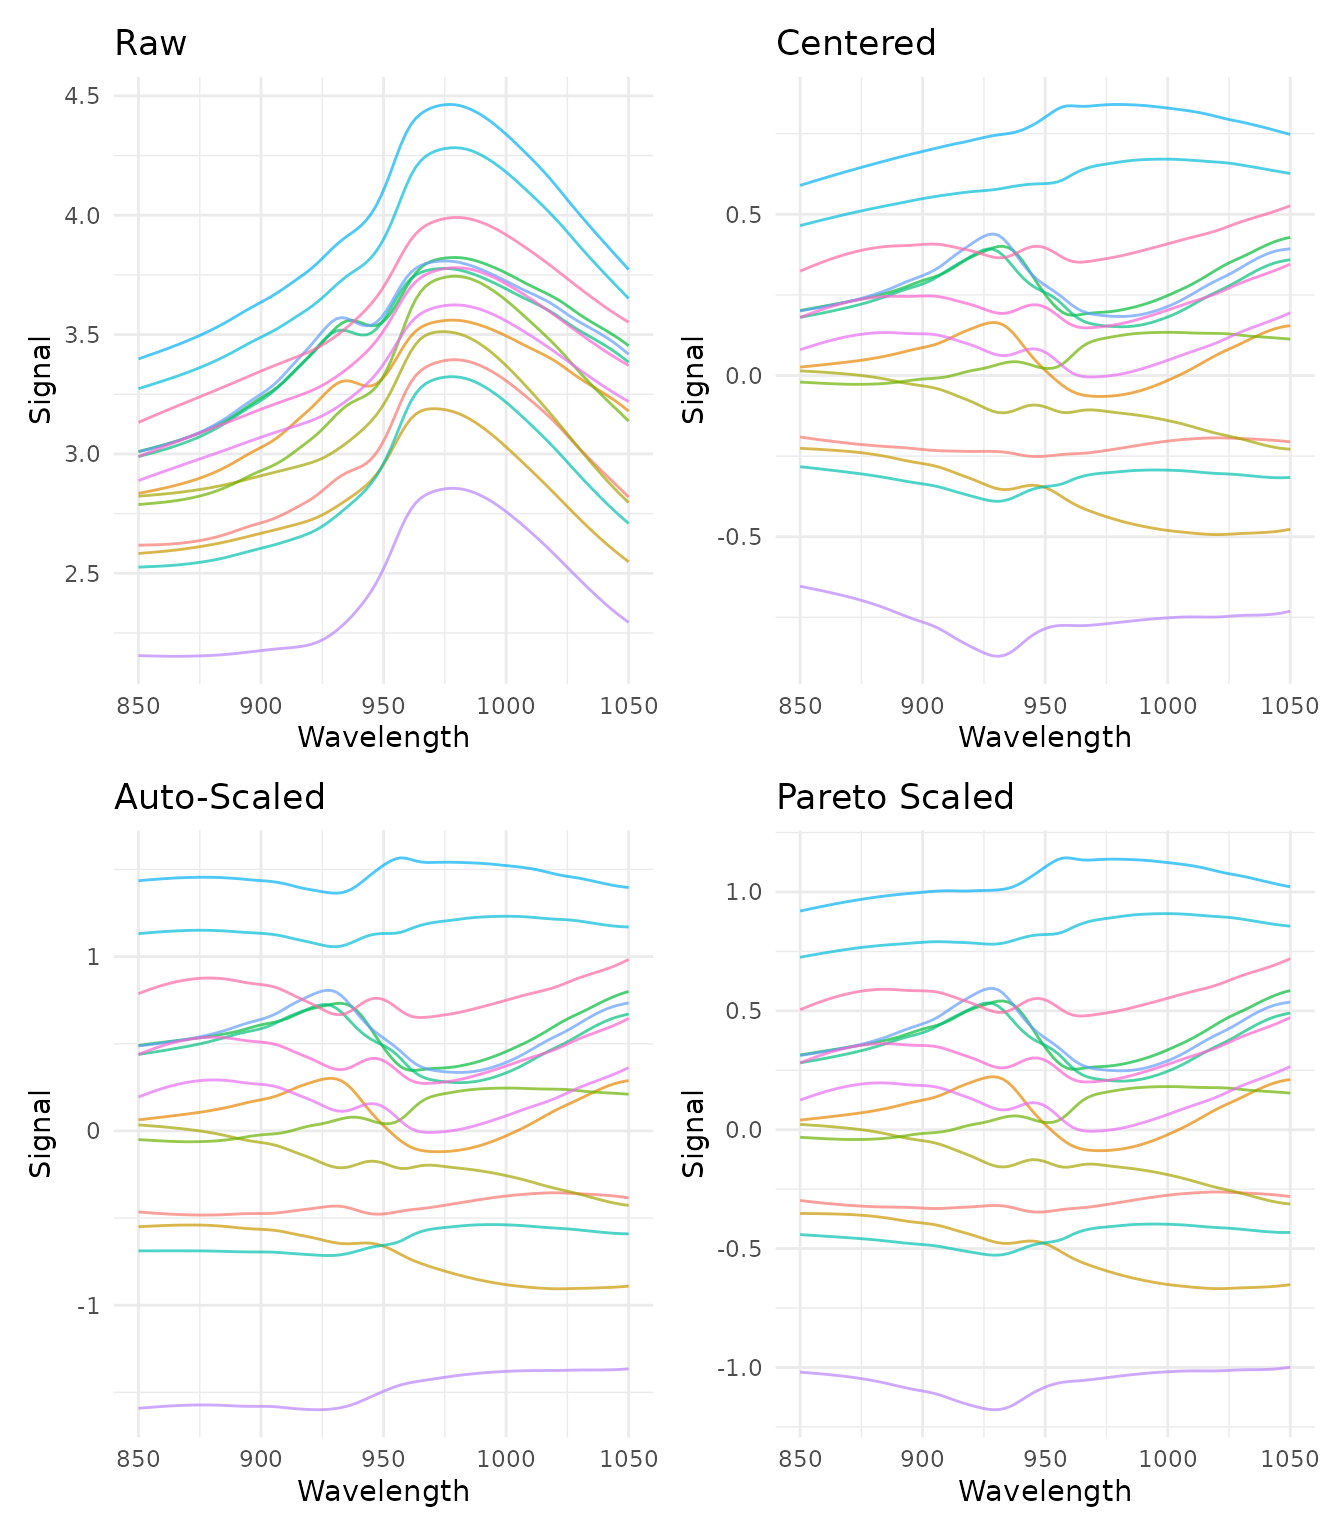
Four panels compare raw absorbance with centered, auto-scaled, and Pareto-scaled outputs for the first 15 samples. The y-axis scale differs by panel.
Learned parameters
Variable-wise scaling steps store learned parameters that can be examined after training:
rec_prepped <- prep(rec_auto)

# View learned parameters
tidy_params <- tidy(rec_prepped, number = 2)
head(tidy_params)
#> # A tibble: 6 × 5
#>   terms     location  mean    sd id
#>   <chr>        <dbl> <dbl> <dbl> <chr>
#> 1 .measures     850   2.81 0.411 measure_scale_auto_JTWJd
#> 2 .measures     852.  2.81 0.413 measure_scale_auto_JTWJd
#> 3 .measures     854.  2.81 0.416 measure_scale_auto_JTWJd
#> 4 .measures     856.  2.82 0.418 measure_scale_auto_JTWJd
#> 5 .measures     858.  2.82 0.421 measure_scale_auto_JTWJd
#> 6 .measures     860.  2.82 0.424 measure_scale_auto_JTWJd

# Plot the learned means and SDs
ggplot(tidy_params, aes(x = location)) +
  geom_ribbon(aes(ymin = mean - sd, ymax = mean + sd), fill = "#D9EAF2") +
  geom_line(aes(y = mean), colour = "#2166AC", linewidth = 0.8) +
  labs(
    x = "Example coordinate",
    y = "Mean absorbance (source data scale)"
  ) +
  theme_measure()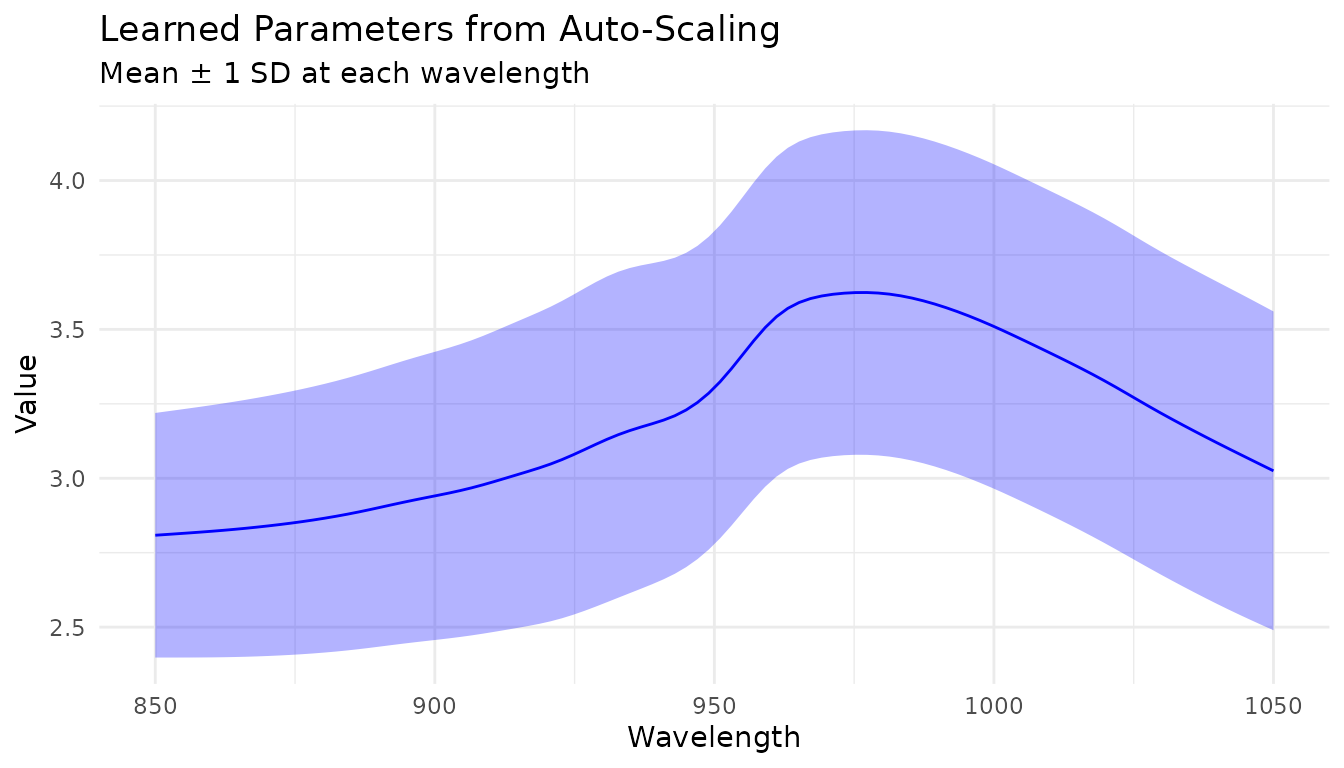
The location-wise mean and one-standard-deviation band learned by the
auto-scaling step from the meats training data.
Custom Transformations
When built-in steps aren’t enough
The built-in preprocessing steps cover the most common operations, but you may need domain-specific transformations:
- Custom baseline correction algorithms
- Instrument-specific corrections
- Experimental preprocessing techniques
- Transformations from specialized packages
step_measure_map() provides an “escape hatch” for
applying any custom function to your measurements while staying within
the recipes framework.
Using step_measure_map()
The function you provide must accept a tibble with
location and value columns and return a tibble
with the same structure:
# Example: Shift spectra to start at zero
zero_baseline <- function(x) {

x$value <- x$value - min(x$value)
x
}

rec_custom <- recipe(water ~ ., data = meats) |>
step_measure_input_wide(starts_with("x_"), location_values = example_grid) |>
step_measure_map(zero_baseline) |>
step_measure_snv()

plot_spectra(get_internal(rec_custom), "Custom Zero-Baseline + SNV")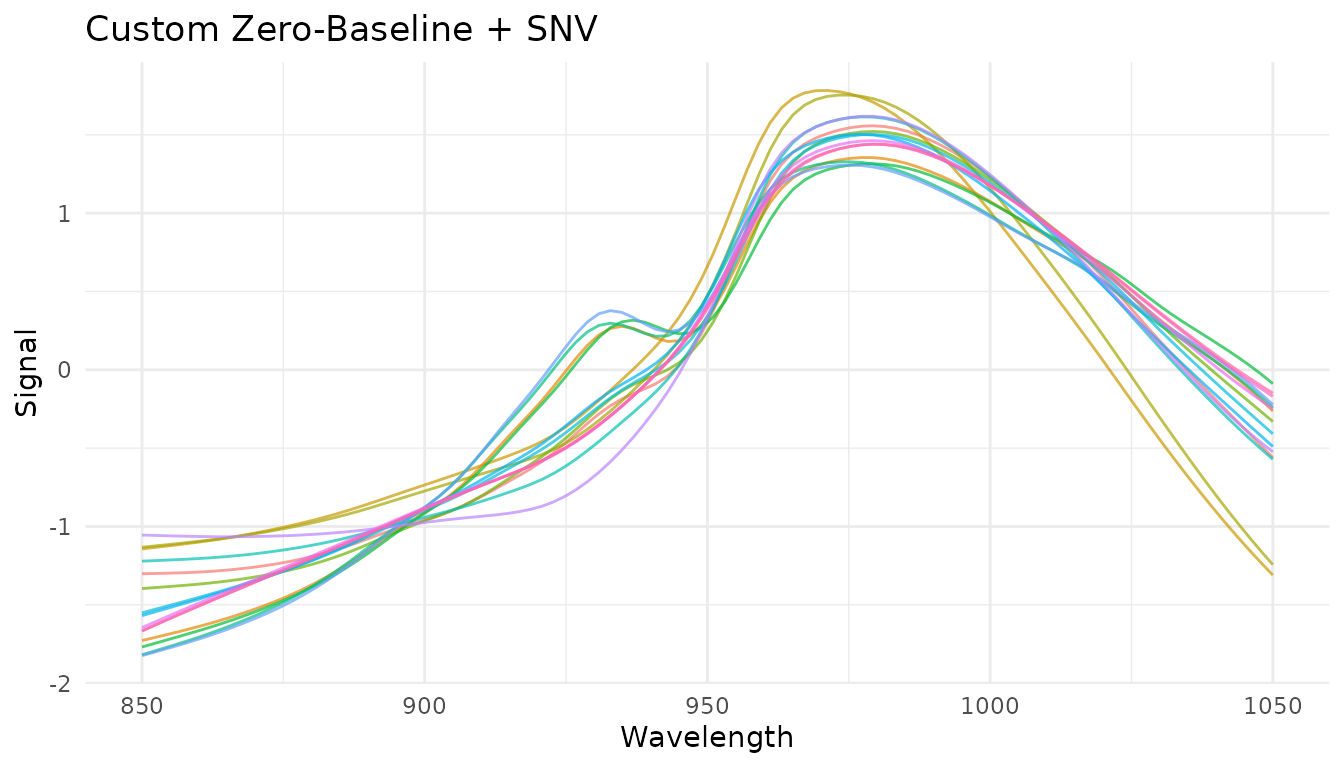
The first 15 spectra after subtracting each sample’s minimum and then applying SNV. Both transformations operate within each sample.
Formula syntax for inline transformations
For simple transformations, use formula syntax instead of defining a separate function:
rec_inline <- recipe(water ~ ., data = meats) |>
step_measure_input_wide(starts_with("x_"), location_values = example_grid) |>
step_measure_map(~ {
# Log transform (common for absorbance data)
.x$value <- log1p(.x$value)
.x
})
Passing additional arguments
You can pass extra arguments to your transformation function:
robust_scale <- function(x, center_fn = median, scale_fn = mad) {
  x$value <- (x$value - center_fn(x$value)) / scale_fn(x$value)
  x
}

rec_robust <- recipe(water ~ ., data = meats) |>
  step_measure_input_wide(starts_with("x_"), location_values = example_grid) |>
  step_measure_map(robust_scale, center_fn = mean, scale_fn = stats::sd)

bake(prep(rec_robust), new_data = NULL) |>
  select(water) |>
  head()
#> # A tibble: 6 × 1
#>   water
#>   <dbl>
#> 1  60.5
#> 2  46
#> 3  71
#> 4  72.8
#> 5  58.3
#> 6  44
Prototyping with measure_map()
When developing a custom transformation, it helps to prototype
interactively before putting it in a recipe. Use
measure_map() for exploration:
# First, get data in internal format
rec_internal <- recipe(water ~ ., data = meats) |>
step_measure_input_wide(starts_with("x_"), location_values = example_grid) |>
prep()

baked_data <- bake(rec_internal, new_data = NULL)

# Prototype your transformation
result <- measure_map(baked_data, ~ {
# Experiment with different approaches
.x$value <- .x$value - median(.x$value)
.x
})

# Check results
result$.measures[[1]]
#> <measure_tbl [100 x 2]>
#> # A tibble: 100 × 2
#>    location  value
#>       <dbl>  <dbl>
#>  1     850  -0.317
#>  2     852. -0.316
#>  3     854. -0.316
#>  4     856. -0.315
#>  5     858. -0.314
#>  6     860. -0.314
#>  7     862. -0.312
#>  8     864. -0.311
#>  9     866. -0.309
#> 10     868. -0.307
#> # ℹ 90 more rows
Once your transformation works correctly, move it into
step_measure_map() for production use. This ensures the
transformation is:
Handling problematic samples
Use measure_map_safely() when exploring data that might
have problematic samples:
# Make the first sample invalid to show how its error is captured.
problem_data <- baked_data
problem_data$.measures[[1]]$value[1] <- 0

risky_transform <- function(x) {
  if (any(x$value <= 0)) stop("Non-positive values!")
  x$value <- log(x$value)
  x
}

safe_result <- measure_map_safely(problem_data, risky_transform)
safe_result$errors
#> # A tibble: 1 × 3
#>   column    sample error
#>   <chr>      <int> <chr>
#> 1 .measures      1 Non-positive values!

# The other samples are transformed; the failed sample keeps its original values.
head(safe_result$result$.measures[[1]])
#> <measure_tbl [6 x 2]>
#> # A tibble: 6 × 2
#>   location value
#>      <dbl> <dbl>
#> 1     850   0
#> 2     852.  2.62
#> 3     854.  2.62
#> 4     856.  2.62
#> 5     858.  2.62
#> 6     860.  2.62
Understanding your data with measure_summarize()
Before preprocessing, it’s often helpful to compute summary statistics across samples:
# Compute mean and SD at each wavelength
summary_stats <- measure_summarize(baked_data)
summary_stats
#> # A tibble: 100 × 3
#>    location  mean    sd
#>       <dbl> <dbl> <dbl>
#>  1     850   2.81 0.411
#>  2     852.  2.81 0.413
#>  3     854.  2.81 0.416
#>  4     856.  2.82 0.418
#>  5     858.  2.82 0.421
#>  6     860.  2.82 0.424
#>  7     862.  2.83 0.426
#>  8     864.  2.83 0.429
#>  9     866.  2.83 0.432
#> 10     868.  2.84 0.434
#> # ℹ 90 more rows

# Visualize the mean spectrum with variability
ggplot(summary_stats, aes(x = location)) +
  geom_ribbon(aes(ymin = mean - sd, ymax = mean + sd), fill = "#D9EAF2") +
  geom_line(aes(y = mean), colour = "#2166AC", linewidth = 0.8) +
  labs(
    x = "Example coordinate",
    y = "Mean absorbance (source data scale)"
  ) +
  theme_measure()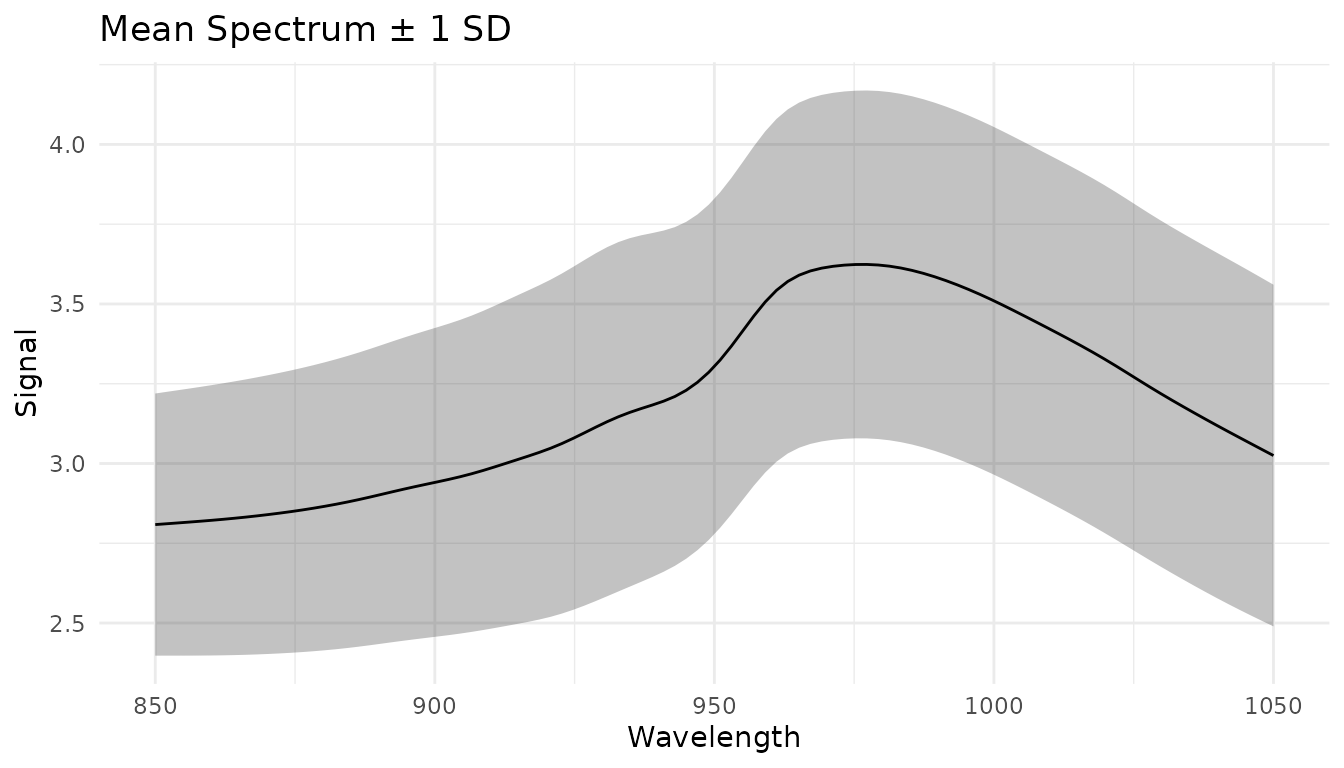
Mean absorbance across the full baked meats dataset, with a band showing one standard deviation below and above the mean at each coordinate.
This can help identify: - Wavelength regions with high variability - Potential outliers - Reference spectra for custom corrections
Preprocessing pipelines
Common combinations
Here are some commonly used preprocessing pipelines:
# Pipeline 1: Basic scatter correction
pipe1 <- recipe(water ~ ., data = meats) |>
  step_measure_input_wide(starts_with("x_")) |>
  step_measure_snv() |>
  step_measure_output_wide()

# Pipeline 2: Derivative + normalization
pipe2 <- recipe(water ~ ., data = meats) |>
  step_measure_input_wide(starts_with("x_")) |>
  step_measure_savitzky_golay(window_side = 5, differentiation_order = 1) |>
  step_measure_snv() |>
  step_measure_output_wide()

# Pipeline 3: Second derivative (often enough on its own)
pipe3 <- recipe(water ~ ., data = meats) |>
  step_measure_input_wide(starts_with("x_")) |>
  step_measure_savitzky_golay(window_side = 7, differentiation_order = 2) |>
  step_measure_output_wide()

# Pipeline 4: MSC + smoothing
pipe4 <- recipe(water ~ ., data = meats) |>
  step_measure_input_wide(starts_with("x_")) |>
  step_measure_msc() |>
  step_measure_savitzky_golay(window_side = 5, differentiation_order = 0) |>
  step_measure_output_wide()

# Pipeline 5: For PCA/PLS - SNV + centering
pipe5 <- recipe(water ~ ., data = meats) |>
  step_measure_input_wide(starts_with("x_")) |>
  step_measure_snv() |>
  step_measure_center() |>
  step_measure_output_wide()

# Pipeline 6: Metabolomics-style with Pareto scaling
pipe6 <- recipe(water ~ ., data = meats) |>
  step_measure_input_wide(starts_with("x_")) |>
  step_measure_normalize_sum() |>
  step_measure_scale_pareto() |>
  step_measure_output_wide()
Order of operations
The order of preprocessing steps matters. General guidelines:
- Derivatives first: Apply Savitzky-Golay derivatives before other transformations
- Sample-wise normalization before variable-wise scaling: Normalize spectra (SNV, MSC, normalize_*) before centering/scaling
- Center/scale last: Variable-wise scaling should typically be the final step before modeling
- Keep it simple: Often, a single well-chosen step outperforms complex pipelines
A typical order might be:
Derivatives → Sample normalization (SNV/MSC) → Variable scaling (center/auto-scale)Data Augmentation
Data augmentation steps add controlled variations to training
measurements. They default to skip = TRUE, so
bake() applies them to the retained training data
(new_data = NULL) and skips them for new assessment or
prediction rows.
Adding Random Noise
step_measure_augment_noise() adds random noise to
simulate measurement uncertainty:
rec_noise <- recipe(water ~ ., data = meats) |>
  step_measure_input_wide(starts_with("x_"), location_values = example_grid) |>
  step_measure_augment_noise(
    sd = 0.01,
    distribution = "gaussian",
    relative = TRUE
  ) |>
  step_measure_output_wide()

noise_fit <- prep(rec_noise)
noise_training <- bake(noise_fit, new_data = NULL)
noise_assessment <- bake(noise_fit, new_data = meats[1:5, ])
Random X-axis Shifts
step_measure_augment_shift() applies small random shifts
along the x-axis, helping models become shift-invariant:
rec_shift <- recipe(water ~ ., data = meats) |>
  step_measure_input_wide(starts_with("x_"), location_values = example_grid) |>
  step_measure_augment_shift(max_shift = 2) |>
  step_measure_output_wide()

shift_fit <- prep(rec_shift)
shift_training <- bake(shift_fit, new_data = NULL)
shift_assessment <- bake(shift_fit, new_data = meats[1:5, ])
Random Intensity Scaling
step_measure_augment_scale() applies random scaling
factors to intensities:
rec_scale <- recipe(water ~ ., data = meats) |>
  step_measure_input_wide(starts_with("x_"), location_values = example_grid) |>
  step_measure_augment_scale(range = c(0.9, 1.1)) |>
  step_measure_output_wide()

scale_fit <- prep(rec_scale)
scale_training <- bake(scale_fit, new_data = NULL)
scale_assessment <- bake(scale_fit, new_data = meats[1:5, ])
Combining Augmentations
Multiple augmentation steps can be combined. Augmentations are reproducible - applying the same recipe to the same data produces identical results:
rec_augment <- recipe(water ~ ., data = meats) |>
  step_measure_input_wide(starts_with("x_"), location_values = example_grid) |>
  step_measure_augment_noise(sd = 0.005) |>
  step_measure_augment_shift(max_shift = 1) |>
  step_measure_augment_scale(range = c(0.95, 1.05)) |>
  step_measure_snv() |>
  step_measure_output_wide()

augment_fit <- prep(rec_augment)
training_data <- bake(augment_fit, new_data = NULL)
assessment_data <- bake(augment_fit, new_data = meats[1:5, ])
When to use augmentation: - Training deep learning models - Small training sets where more variation helps - Building shift/scale-invariant models
Summary table
Filtering and Scatter Correction
| Step | Effect | Use when |
|---|---|---|
step_measure_savitzky_golay(order=0) |
Smoothing | High-frequency noise |
step_measure_savitzky_golay(order=1) |
1st derivative | Baseline offsets |
step_measure_savitzky_golay(order=2) |
2nd derivative | Linear baselines |
step_measure_snv() |
Row normalization | Scatter, path length |
step_measure_msc() |
Align to reference | Scatter (supervised) |
step_measure_emsc() |
Wavelength-dependent MSC | Complex scatter effects |
step_measure_osc() |
Remove orthogonal variance | Supervised noise removal |
Spectral Math
| Step | Effect | Use when |
|---|---|---|
step_measure_absorbance() |
T → A | Convert transmittance |
step_measure_transmittance() |
A → T | Convert absorbance |
step_measure_log() |
Log transform | Variance stabilization |
step_measure_kubelka_munk() |
K-M transform | Diffuse reflectance |
step_measure_derivative() |
Finite difference | Fast unsmoothed derivative |
step_measure_derivative_gap() |
Gap derivative | NIR chemometrics |
Sample-wise Normalization
| Step | Effect | Use when |
|---|---|---|
step_measure_normalize_sum() |
Divide by sum | Total intensity differences |
step_measure_normalize_max() |
Divide by max | Peak-focused analysis |
step_measure_normalize_range() |
Scale to 0-1 | Neural networks, visualization |
step_measure_normalize_vector() |
L2 normalization | Euclidean distance methods |
step_measure_normalize_auc() |
Divide by AUC | Chromatography |
step_measure_normalize_peak() |
Divide by region | Internal standard |
Variable-wise Scaling
| Step | Effect | Use when |
|---|---|---|
step_measure_center() |
Subtract mean | Before PCA/PLS (essential) |
step_measure_scale_auto() |
Z-score | Equal variable importance |
step_measure_scale_pareto() |
Pareto scaling | Metabolomics |
step_measure_scale_range() |
Range scaling | Bounded scaling |
step_measure_scale_vast() |
VAST scaling | Variable stability focus |
Region Operations
| Step | Effect | Use when |
|---|---|---|
step_measure_trim() |
Keep x-range | Focus on region of interest |
step_measure_exclude() |
Remove x-ranges | Remove solvent peaks, artifacts |
step_measure_resample() |
Interpolate to grid | Align instruments, reduce density |
Smoothing & Noise Reduction
| Step | Effect | Use when |
|---|---|---|
step_measure_smooth_ma() |
Moving average | Simple noise reduction |
step_measure_smooth_median() |
Median filter | Spike removal, robust smoothing |
step_measure_smooth_gaussian() |
Gaussian kernel | Preserve peak shapes |
step_measure_smooth_wavelet() |
Wavelet denoising | Complex noise patterns |
step_measure_filter_fourier() |
Frequency filtering | Periodic noise removal |
step_measure_despike() |
Spike removal | Cosmic rays, detector glitches |
Alignment & Registration
| Step | Effect | Use when |
|---|---|---|
step_measure_align_shift() |
Cross-correlation alignment | Simple linear shifts |
step_measure_align_reference() |
Align to reference | External calibration standard |
step_measure_align_dtw() |
Dynamic time warping | Non-linear distortions |
step_measure_align_ptw() |
Parametric time warping | Polynomial warping functions |
step_measure_align_cow() |
Correlation optimized warping | Piecewise segment alignment |
Quality Control
| Step | Effect | Use when |
|---|---|---|
step_measure_qc_snr() |
Calculate SNR | Quality filtering |
step_measure_qc_saturated() |
Detect saturation | Identify clipped data |
step_measure_qc_outlier() |
Detect outliers | Sample screening |
step_measure_impute() |
Fill missing values | Gap interpolation |
Baseline Correction
| Step | Effect | Use when |
|---|---|---|
step_measure_baseline_als() |
Asymmetric LS | Smooth baselines, general purpose |
step_measure_baseline_poly() |
Polynomial fit | Simple, predictable baselines |
step_measure_baseline_rolling() |
Rolling ball | Wide peaks, chromatography |
step_measure_baseline_airpls() |
Adaptive weights | Complex, varying baselines |
step_measure_baseline_arpls() |
Asymmetric reweighted PLS | Robust to outliers |
step_measure_baseline_snip() |
Iterative clipping | Sharp peaks, spectroscopy |
step_measure_baseline_tophat() |
Top-hat filter | Morphological baseline |
step_measure_baseline_morph() |
Iterative morphological | Gradual baselines |
step_measure_baseline_minima() |
Local minima interpolation | Simple chromatography |
step_measure_baseline_auto() |
Automatic selection | Unknown baseline type |
step_measure_detrend() |
Polynomial detrend | Linear/quadratic drift |
Peak Operations
| Step | Effect | Use when |
|---|---|---|
step_measure_peaks_detect() |
Find peaks | Chromatography, feature extraction |
step_measure_peaks_integrate() |
Calculate areas | Quantitative analysis |
step_measure_peaks_filter() |
Remove small peaks | Focus on major peaks |
step_measure_peaks_deconvolve() |
Separate overlapping peaks | Resolve co-eluting peaks |
step_measure_peaks_to_table() |
Wide format output | Modeling with peak features |
SEC/GPC Analysis
| Step | Effect | Use when |
|---|---|---|
step_measure_mw_averages() |
Calculate Mn, Mw, Mz, Mp, Đ | Polymer characterization |
step_measure_mw_distribution() |
Generate MW distribution curve | Distribution analysis |
step_measure_mw_fractions() |
Calculate MW fractions | Size-based fractionation |
Feature Engineering
| Step | Effect | Use when |
|---|---|---|
step_measure_integrals() |
Calculate region areas | Quantify peak regions |
step_measure_ratios() |
Calculate region ratios | Internal calibration |
step_measure_moments() |
Extract statistical moments | Shape characterization |
step_measure_bin() |
Reduce spectral resolution | Dimensionality reduction |
Data Augmentation
| Step | Effect | Use when |
|---|---|---|
step_measure_augment_noise() |
Add random noise | Training robustness |
step_measure_augment_shift() |
Random x-axis shifts | Shift invariance |
step_measure_augment_scale() |
Random intensity scaling | Scale invariance |
Tips for choosing preprocessing
- Start simple: Try SNV or first derivative alone before complex pipelines
- Visualize: Always plot preprocessed spectra to check for artifacts
- Validate: Use cross-validation to compare preprocessing strategies
- Domain knowledge: Consider the physics of your measurement system
-
Tune: Use
tune()to optimize Savitzky-Golay parameters
References
- Savitzky, A., and Golay, M. J. E. (1964). Smoothing and Differentiation of Data by Simplified Least Squares Procedures. Analytical Chemistry, 36(8), 1627-1639.
- Barnes, R. J., Dhanoa, M. S., and Lister, S. J. (1989). Standard Normal Variate Transformation and De-Trending of Near-Infrared Diffuse Reflectance Spectra. Applied Spectroscopy, 43(5), 772-777.
- Geladi, P., MacDougall, D., and Martens, H. (1985). Linearization and Scatter-Correction for Near-Infrared Reflectance Spectra of Meat. Applied Spectroscopy, 39(3), 491-500.
See Also
- Getting Started - Introduction to measure workflows
- Baseline Correction - Detailed guide to baseline methods
- Integrating with tidymodels - Use preprocessing in modeling workflows