A dataset containing raw SEC chromatograms with RI, UV, and MALS detector signals that have NOT been corrected for inter-detector delay. Designed for teaching triple detection workflows from raw data.
Format
A tibble with approximately 48,000 rows and 12 columns:
- sample_id
Character. Sample identifier
- description
Character. Sample description
- mw
Numeric. Known weight-average MW in Da
- dispersity
Numeric. Known dispersity
- dn_dc
Numeric. Refractive index increment in mL/g
- ext_coef
Numeric. UV extinction coefficient
- time_min
Numeric. Elution time in minutes
- ri_mv
Numeric. RI detector signal in millivolts
- uv_au
Numeric. UV detector signal in absorbance units
- mals_mv
Numeric. MALS detector signal in millivolts
- delay_uv_ml
Numeric. True UV detector delay in mL (negative = before RI)
- delay_mals_ml
Numeric. True MALS detector delay in mL (positive = after RI)
Details
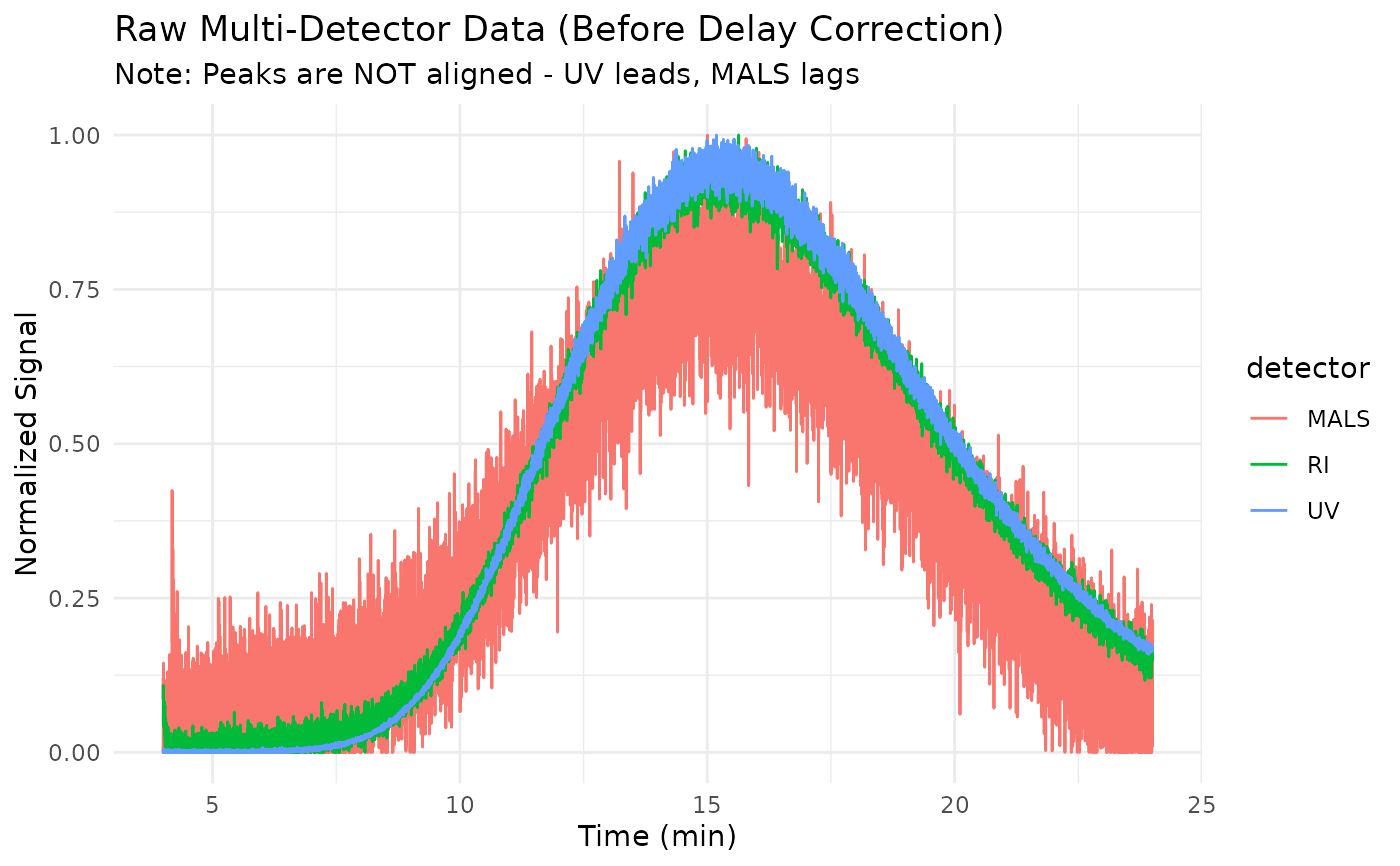
This dataset simulates raw multi-detector SEC data before inter-detector delay correction. The detectors are physically separated in the flow path, so peaks appear at different times in each detector.
Detector Configuration:
UV detector is 0.08 mL BEFORE RI (peaks appear earlier)
MALS detector is 0.18 mL AFTER RI (peaks appear later)
RI is the reference detector (delay = 0)
Samples Included:
PS-DelayStd: Narrow PS standard for determining delays
Sample-1: PS sample with strong UV absorption
Sample-2: PMMA sample with weak UV
Sample-3: Copolymer sample
Tutorial Workflow:
Load raw multi-detector data
Use delay standard to determine inter-detector offsets
Apply
step_sec_detector_delayto align signalsProcess with
step_sec_malsfor absolute MW
See also
step_sec_detector_delay for delay correction
step_sec_mals for MALS processing
sec_triple_detect for pre-processed multi-detector data
Other sec-data:
sec_branched,
sec_calibration_standards,
sec_copolymer,
sec_pmma_standards,
sec_protein,
sec_ps_standards,
sec_raw_standards,
sec_raw_unknowns,
sec_system_suitability,
sec_triple_detect
Other sec-raw:
sec_raw_standards,
sec_raw_unknowns
Examples
data(sec_raw_multidetector)

# View sample information
unique(sec_raw_multidetector[, c("sample_id", "description", "mw")])
#> # A tibble: 4 × 3
#>   sample_id   description                           mw
#>   <chr>       <chr>                              <dbl>
#> 1 PS-DelayStd Narrow PS for delay determination 100000
#> 2 Sample-1    PS sample with UV absorption       75000
#> 3 Sample-2    PMMA sample (weak UV)             150000
#> 4 Sample-3    Copolymer sample                   45000

# Plot delay standard showing detector offset (peaks not aligned)
if (requireNamespace("ggplot2", quietly = TRUE)) {
  library(ggplot2)
  library(dplyr)
  library(tidyr)

  sec_raw_multidetector |>
    filter(sample_id == "PS-DelayStd") |>
    select(time_min, ri_mv, uv_au, mals_mv) |>
    # Normalize for comparison
    mutate(
      ri_norm = ri_mv / max(ri_mv),
      uv_norm = uv_au / max(uv_au),
      mals_norm = mals_mv / max(mals_mv)
    ) |>
    select(time_min, RI = ri_norm, UV = uv_norm, MALS = mals_norm) |>
    pivot_longer(-time_min, names_to = "detector", values_to = "signal") |>
    ggplot(aes(time_min, signal, color = detector)) +
    geom_line() +
    labs(
      x = "Time (min)",
      y = "Normalized Signal",
      title = "Raw Multi-Detector Data (Before Delay Correction)",
      subtitle = "Note: Peaks are NOT aligned - UV leads, MALS lags"
    ) +
    theme_minimal()
}