A dataset containing raw SEC chromatograms of polymer samples with known true molecular weight values for validation. Includes challenging cases like bimodal distributions and high molecular weight aggregates.
Format
A tibble with approximately 65,000 rows and 8 columns:
- sample_id
Character. Sample identifier
- description
Character. Sample description and type
- true_mw
Numeric. Known weight-average MW in Da (NA for bimodal)
- true_mn
Numeric. Known number-average MW in Da
- true_mz
Numeric. Known z-average MW in Da
- true_dispersity
Numeric. Known dispersity (Mw/Mn)
- time_min
Numeric. Elution time in minutes
- ri_mv
Numeric. RI detector signal in millivolts (raw)
Details
This dataset provides unknown samples with known "true" MW values, enabling validation of the complete SEC workflow from raw data to final results.
Sample Types:
Unknown-A: Broad distribution (dispersity ~2.0)
Unknown-B: Medium dispersity (~1.3)
Unknown-C: Narrow distribution (~1.1) for accuracy check
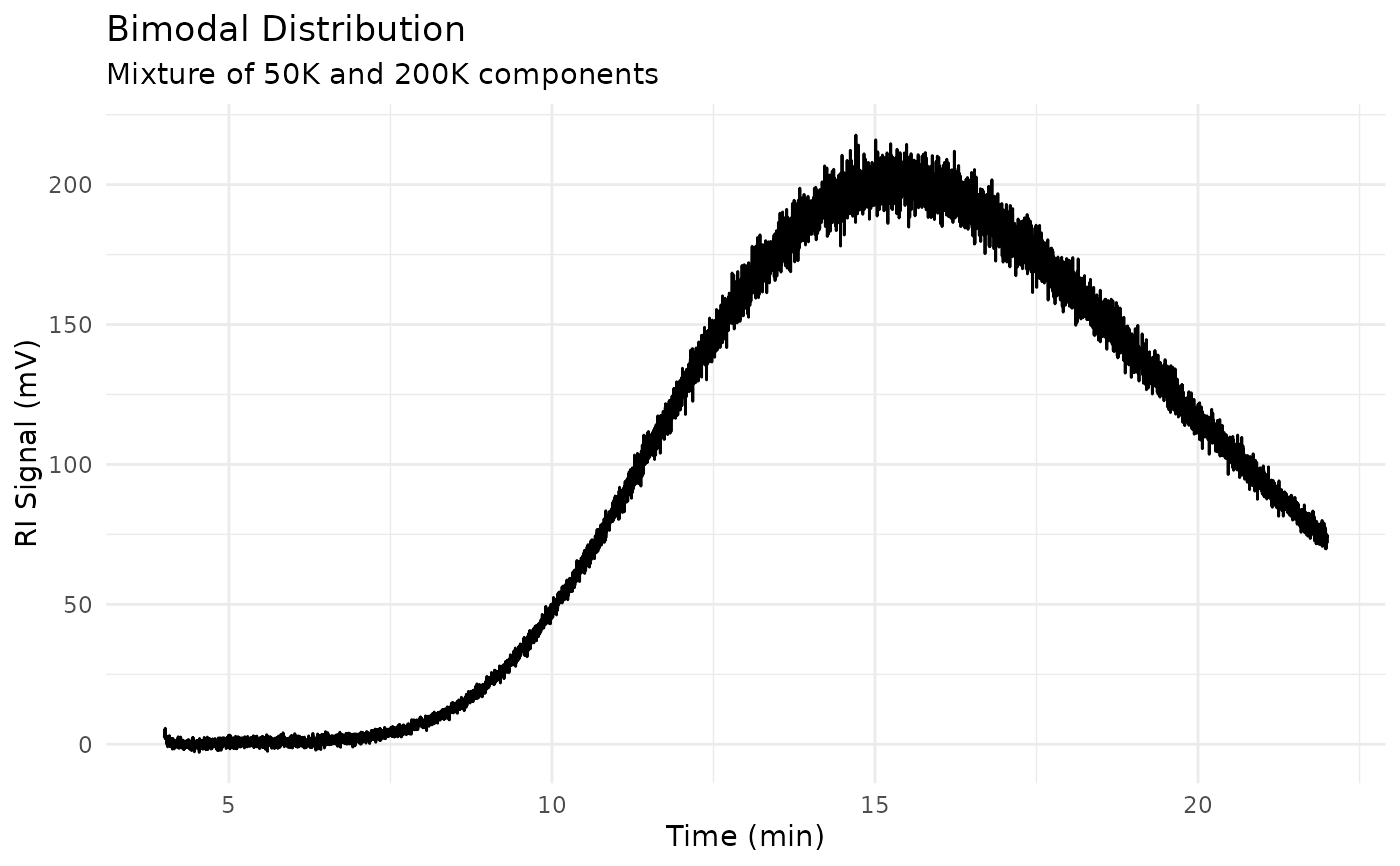
Unknown-Bimodal: Two-peak mixture (50K + 200K)
Unknown-HMW: Very high MW (~1.5M) with aggregate shoulder
Unknown-LMW: Low MW oligomers (~3.5K)
Educational Value: Students can compare their calculated MW values against the true values to validate their analysis workflow and understand sources of error.
See also
sec_raw_standards for calibration standards
step_sec_mw_averages for MW calculation
Other sec-data:
sec_branched,
sec_calibration_standards,
sec_copolymer,
sec_pmma_standards,
sec_protein,
sec_ps_standards,
sec_raw_multidetector,
sec_raw_standards,
sec_system_suitability,
sec_triple_detect
Other sec-raw:
sec_raw_multidetector,
sec_raw_standards
Examples
data(sec_raw_unknowns)

# View sample information
unique(sec_raw_unknowns[,
  c("sample_id", "description", "true_mw", "true_dispersity")])
#> # A tibble: 6 × 4
#>   sample_id       description                   true_mw true_dispersity
#>   <chr>           <chr>                           <dbl>           <dbl>
#> 1 Unknown-A       Broad distribution PMMA-like    45000            2.05
#> 2 Unknown-B       Medium dispersity PS-like      125000            1.32
#> 3 Unknown-C       Narrow distribution reference   82000            1.09
#> 4 Unknown-Bimodal Bimodal mixture (50K + 200K)       NA           NA
#> 5 Unknown-HMW     Very high MW with aggregates  1500000            1.25
#> 6 Unknown-LMW     Low MW oligomer region           3500            1.25

# Plot the bimodal sample
if (requireNamespace("ggplot2", quietly = TRUE)) {
  library(ggplot2)
  library(dplyr)

  sec_raw_unknowns |>
    filter(sample_id == "Unknown-Bimodal") |>
    ggplot(aes(time_min, ri_mv)) +
    geom_line() +
    labs(
      x = "Time (min)",
      y = "RI Signal (mV)",
      title = "Bimodal Distribution",
      subtitle = "Mixture of 50K and 200K components"
    ) +
    theme_minimal()
}