Polystyrene narrow molecular weight standards for SEC/GPC conventional
calibration. A convenient subset of sec_calibration_standards
containing only polystyrene standards.
Format
A tibble with 16 rows and 12 columns:
- standard_name
Character. Standard identifier (e.g., "PS-67500")
- mp
Numeric. Peak molecular weight in Da
- log_mp
Numeric. log10(Mp) for calibration curve fitting
- retention_time
Numeric. Peak retention time in minutes
- retention_volume
Numeric. Peak retention volume in mL
- mn
Numeric. Number-average molecular weight in Da
- mw
Numeric. Weight-average molecular weight in Da
- dispersity
Numeric. Polydispersity index (Mw/Mn)
- mp_uncertainty
Numeric. Relative uncertainty in Mp
- k_value
Numeric. Mark-Houwink K constant (0.000141 mL/g)
- a_value
Numeric. Mark-Houwink exponent (0.700)
- dn_dc
Numeric. Refractive index increment (0.185 mL/g)
Details
Polystyrene is the most widely used SEC calibration standard due to its:
Availability in narrow dispersity grades across wide MW range
Well-characterized Mark-Houwink parameters in common solvents
Strong UV absorption for dual detection
Good solubility and stability
The 16 standards span 162 Da to 3,150,000 Da, covering typical analytical SEC columns. Standards are pre-sorted by descending molecular weight (elution order).
Usage with step_sec_conventional_cal:
library(dplyr)
standards <- sec_ps_standards |>
  select(retention = retention_time, log_mw = log_mp)

recipe(~., data = my_data) |>
  step_sec_conventional_cal(standards = standards, fit_type = "cubic")
See also
sec_calibration_standards for full dataset with PMMA
sec_pmma_standards for PMMA standards
step_sec_conventional_cal for calibration step
Other sec-data:
sec_branched,
sec_calibration_standards,
sec_copolymer,
sec_pmma_standards,
sec_protein,
sec_raw_multidetector,
sec_raw_standards,
sec_raw_unknowns,
sec_system_suitability,
sec_triple_detect
Other sec-calibration:
load_sec_calibration(),
save_sec_calibration(),
sec_calibration_standards,
sec_pmma_standards,
step_sec_broad_standard(),
step_sec_conventional_cal(),
step_sec_universal_cal()
Examples
data(sec_ps_standards)
# Quick look at the calibration range
range(sec_ps_standards$mp)
#> [1] 162 3150000
range(sec_ps_standards$retention_time)
#> [1] 11.150 20.787
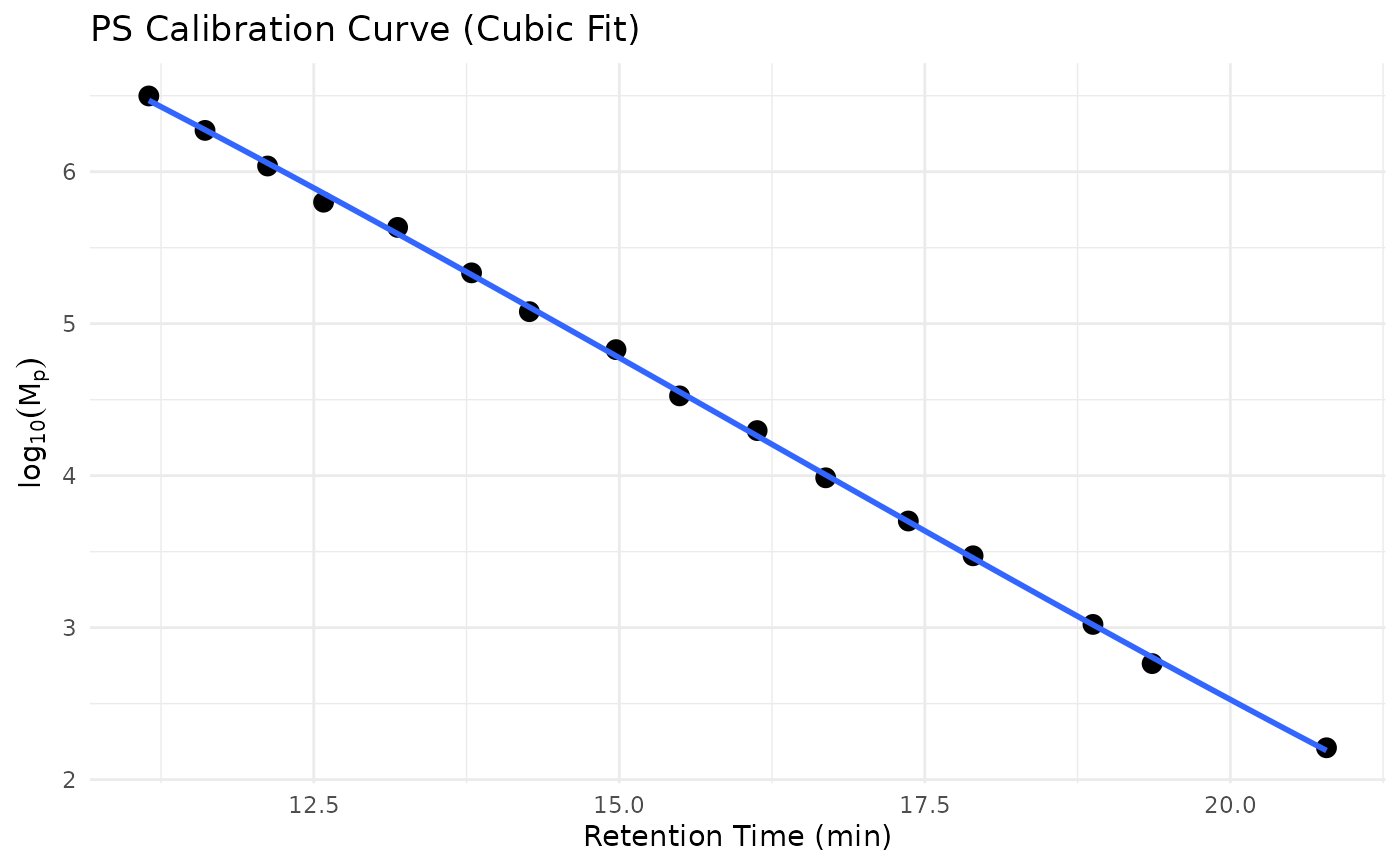
# Plot calibration curve
if (requireNamespace("ggplot2", quietly = TRUE)) {
library(ggplot2)
ggplot(sec_ps_standards, aes(retention_time, log_mp)) +
geom_point(size = 3) +
geom_smooth(method = "lm", formula = y ~ poly(x, 3), se = FALSE) +
labs(
x = "Retention Time (min)",
y = expression(log[10](M[p])),
title = "PS Calibration Curve (Cubic Fit)"
) +
theme_minimal()
}