A synthetic dataset containing SEC chromatograms of linear, branched, and star polymers, designed for demonstrating branching analysis using multi-detector SEC.
Format
A tibble with 5,608 rows and 10 columns:
- sample_id
Character. Sample identifier (e.g., "Linear-50K")
- elution_time
Numeric. Elution time in minutes
- ri_signal
Numeric. Refractive index detector signal
- visc_signal
Numeric. Viscometer detector signal
- mals_signal
Numeric. Multi-angle light scattering signal
- topology
Character. Polymer topology: "linear", "branched", or "star"
- mw
Numeric. Weight-average molecular weight in Da
- branching_index
Numeric. Branching index g' (1.0 for linear)
- intrinsic_visc
Numeric. Intrinsic viscosity in mL/g
- rg
Numeric. Radius of gyration in nm
Details
The dataset includes polyethylene-like samples with three topologies:
Linear polymers (g' = 1.0) at 50K, 100K, 200K MW
Branched polymers (g' = 0.55-0.75) at same MW range
Star polymers (g' = 0.50-0.60) at 50K, 100K MW
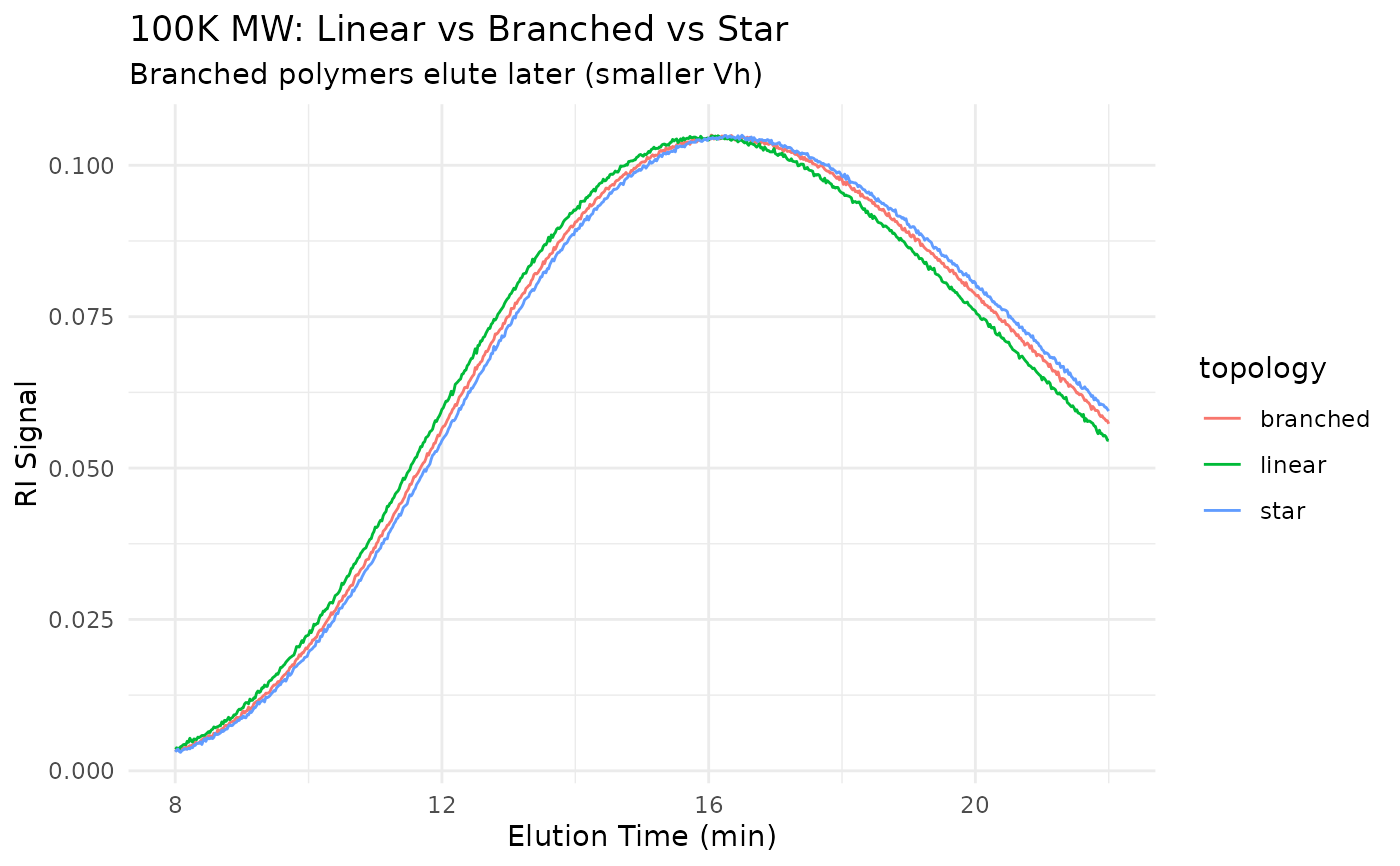
Key Observation: At the same molecular weight, branched polymers have smaller hydrodynamic volume and elute LATER than their linear counterparts. This is the basis for branching analysis by comparing SEC retention to absolute MW from MALS.
Branching Index (g'): g' = \([\eta]_{branched}\) / \([\eta]_{linear}\) at same MW
Values less than 1.0 indicate branching. Lower values mean more compact (more branched) structures.
Typical Workflow:
Apply
step_sec_malsfor absolute MWApply
step_sec_viscometerfor intrinsic viscosityUse
measure_branching_indexto calculate g'Plot Mark-Houwink relationship to compare topologies
Examples
data(sec_branched)

# Compare topologies
unique(sec_branched[, c("sample_id", "topology", "mw", "branching_index")])
#> # A tibble: 8 × 4
#>   sample_id   topology     mw branching_index
#>   <chr>       <chr>     <dbl>           <dbl>
#> 1 Linear-50K  linear    50000            1
#> 2 Linear-100K linear   100000            1
#> 3 Linear-200K linear   200000            1
#> 4 Branch-50K  branched  50000            0.75
#> 5 Branch-100K branched 100000            0.65
#> 6 Branch-200K branched 200000            0.55
#> 7 Star-50K    star      50000            0.6
#> 8 Star-100K   star     100000            0.5

# Plot linear vs branched at same MW
if (requireNamespace("ggplot2", quietly = TRUE)) {
  library(ggplot2)
  library(dplyr)

  sec_branched |>
    filter(mw == 100000) |>
    ggplot(aes(elution_time, ri_signal, color = topology)) +
    geom_line() +
    labs(
      x = "Elution Time (min)",
      y = "RI Signal",
      title = "100K MW: Linear vs Branched vs Star",
      subtitle = "Branched polymers elute later (smaller Vh)"
    ) +
    theme_minimal()
}