A synthetic dataset containing SEC chromatograms of styrene-acrylate copolymers with varying compositions, designed for demonstrating UV/RI ratio analysis for composition determination.
Format
A tibble with 4,206 rows and 8 columns:
- sample_id
Character. Sample identifier (e.g., "Copoly-20S")
- elution_time
Numeric. Elution time in minutes
- ri_signal
Numeric. Refractive index detector signal
- uv_254_signal
Numeric. UV detector signal at 254 nm
- styrene_fraction
Numeric. Styrene content (0-1)
- mw
Numeric. Weight-average molecular weight in Da
- dispersity
Numeric. Polydispersity index (Mw/Mn)
- description
Character. Sample description
Details
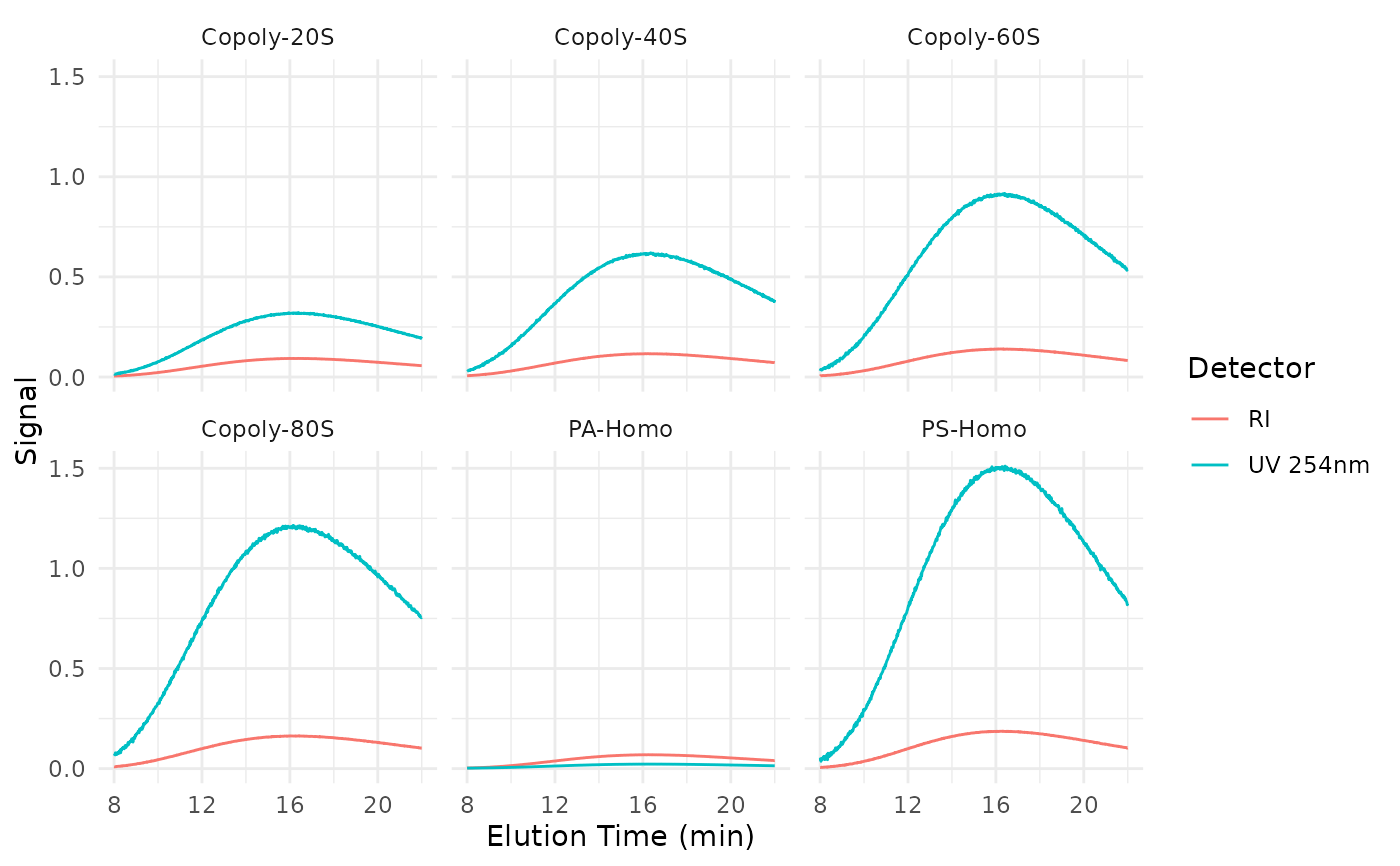
The dataset includes 6 samples spanning the full composition range:
Pure polyacrylate (0% styrene) - no UV absorption
20%, 40%, 60%, 80% styrene copolymers
Pure polystyrene (100% styrene) - strong UV absorption
UV/RI Ratio Analysis: The UV signal at 254 nm is selective for styrene units, while the RI signal responds to total mass. The UV/RI ratio across the chromatogram reveals composition as a function of molecular weight, enabling detection of compositional drift.
Typical Workflow:
Load data and convert to measure format
Apply
step_sec_uv_ri_ratioto calculate ratiosCalibrate ratio to composition using homopolymer standards
Plot composition vs molecular weight
Examples
data(sec_copolymer)

# View composition range
unique(sec_copolymer[, c("sample_id", "styrene_fraction")])
#> # A tibble: 6 × 2
#>   sample_id  styrene_fraction
#>   <chr>                 <dbl>
#> 1 Copoly-20S              0.2
#> 2 Copoly-40S              0.4
#> 3 Copoly-60S              0.6
#> 4 Copoly-80S              0.8
#> 5 PS-Homo                 1
#> 6 PA-Homo                 0

# Plot RI vs UV for different compositions
if (requireNamespace("ggplot2", quietly = TRUE)) {
  library(ggplot2)
  ggplot(sec_copolymer, aes(elution_time)) +
    geom_line(aes(y = ri_signal, color = "RI")) +
    geom_line(aes(y = uv_254_signal, color = "UV 254nm")) +
    facet_wrap(~sample_id) +
    labs(x = "Elution Time (min)", y = "Signal", color = "Detector") +
    theme_minimal()
}