Summary information for the polystyrene calibration standards used with
sec_chromatograms. Contains the known molecular weights and
peak retention times needed to construct a calibration curve.
Format
A tibble with 5 observations and 3 variables:
- standard
Standard name (e.g., "PS_1k")
- mw
Known molecular weight in g/mol
- peak_time
Peak elution time in minutes
Source
Simulated data generated for the measure package. See
data-raw/generate_datasets.R for the generation script.
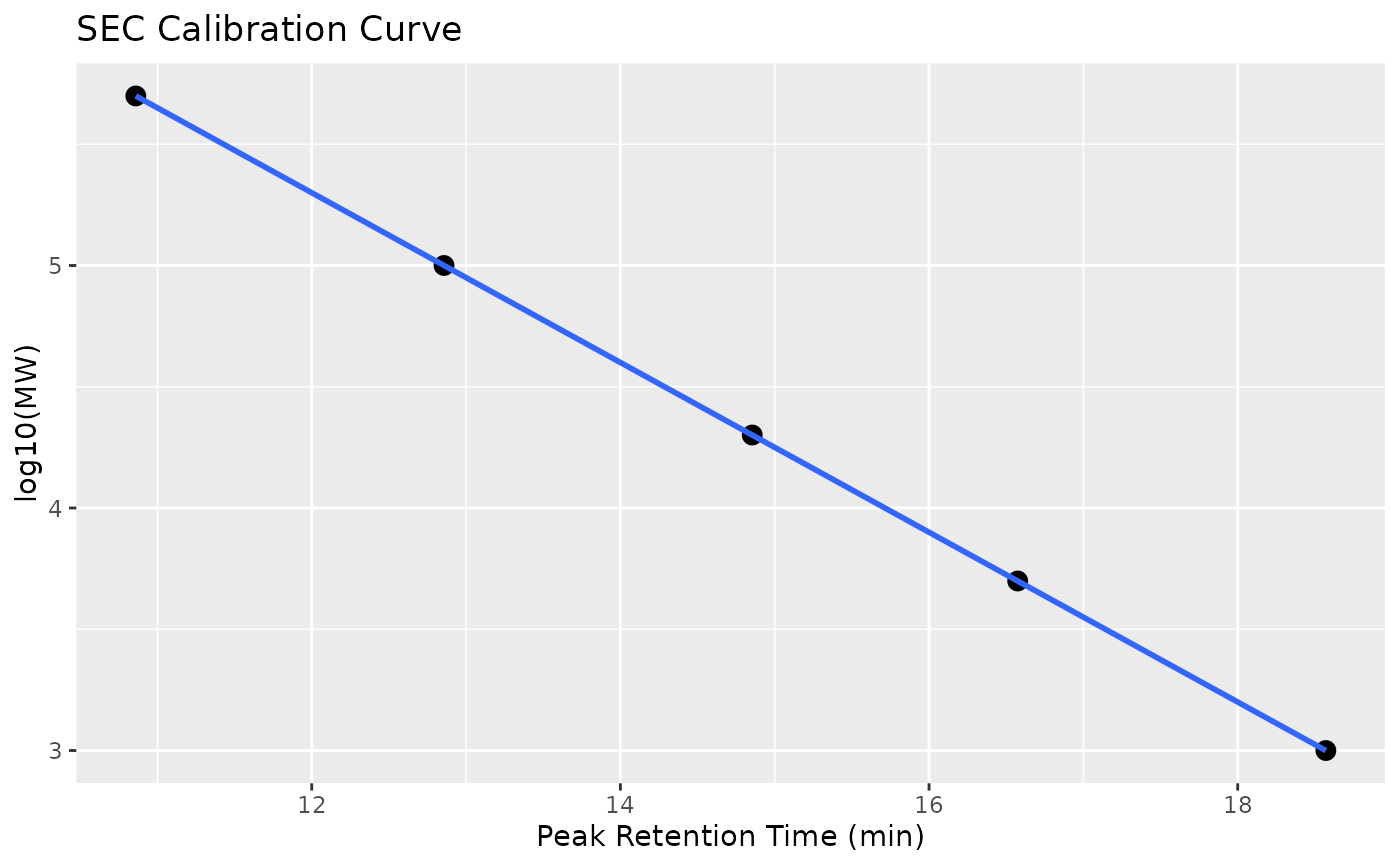
Details
The calibration curve for SEC/GPC relates log(MW) to retention time. For this simulated data: log10(MW) = 9.5 - 0.35 * time
See also
sec_chromatograms for the full chromatogram data
Examples
data(sec_calibration)

# View calibration data
sec_calibration
#> # A tibble: 5 × 3
#>   standard     mw peak_time
#>   <chr>     <dbl>     <dbl>
#> 1 PS_1k      1000      18.6
#> 2 PS_5k      5000      16.6
#> 3 PS_20k    20000      14.9
#> 4 PS_100k  100000      12.9
#> 5 PS_500k  500000      10.9

# Create calibration curve (if ggplot2 available)
if (requireNamespace("ggplot2", quietly = TRUE)) {
  library(ggplot2)
  ggplot(sec_calibration, aes(x = peak_time, y = log10(mw))) +
    geom_point(size = 3) +
    geom_smooth(method = "lm", se = FALSE) +
    labs(x = "Peak Retention Time (min)", y = "log10(MW)",
         title = "SEC Calibration Curve")
}
#> `geom_smooth()` using formula = 'y ~ x'