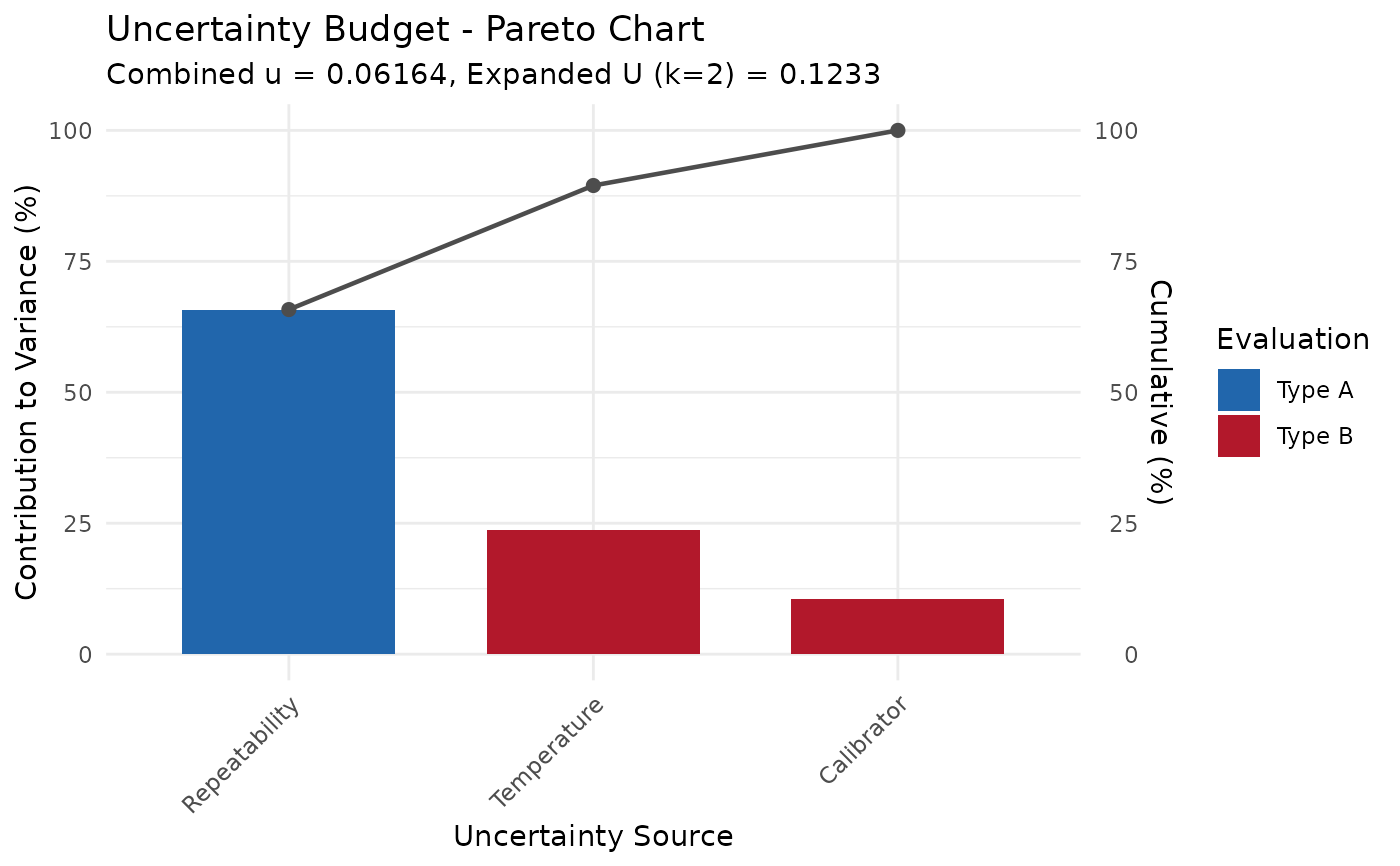
Creates a Pareto chart showing the relative contribution of each uncertainty component to the combined uncertainty.
Usage
# S3 method for class 'measure_uncertainty_budget'
autoplot(object, ...)
Arguments
- object
A measure_uncertainty_budget object.
- ...
Additional arguments (unused).
Examples
library(ggplot2)
u1 <- uncertainty_component("Repeatability", 0.05, type = "A", df = 9)
u2 <- uncertainty_component("Calibrator", 0.02, type = "B")
u3 <- uncertainty_component("Temperature", 0.03, type = "B")
budget <- measure_uncertainty_budget(u1, u2, u3)

autoplot(budget)