Creates diagnostic plots for a calibration curve using ggplot2.
Arguments
- object
A measure_calibration object.
- type
Type of plot:
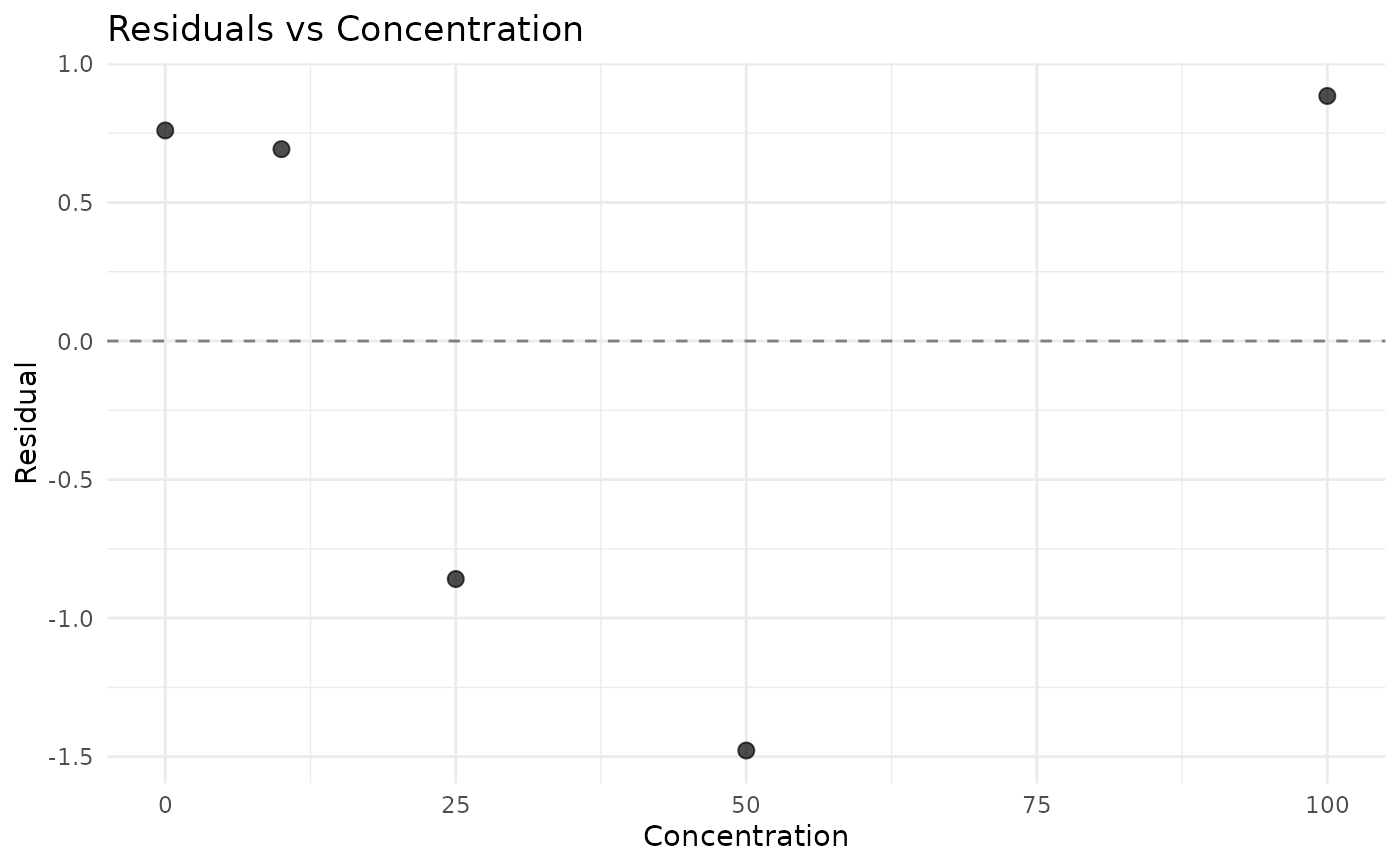
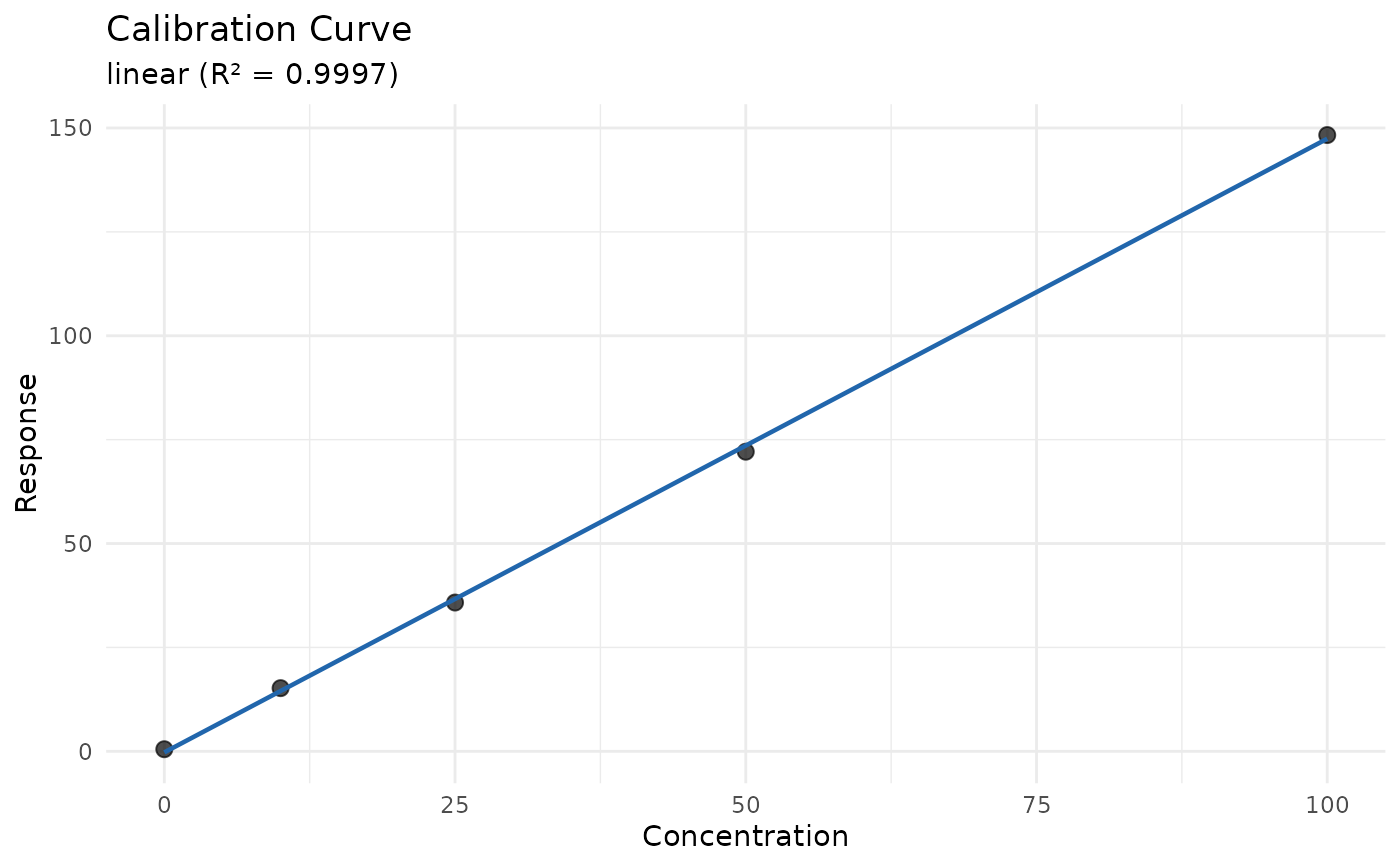
"curve"(default): Calibration curve with data points"residuals": Residuals vs concentration"qq": Normal Q-Q plot of residuals"all": All diagnostic plots combined
- ...
Additional arguments passed to ggplot2 functions.
Examples
library(ggplot2)
data <- data.frame(
  nominal_conc = c(0, 10, 25, 50, 100),
  response = c(0.5, 15.2, 35.8, 72.1, 148.3)
)
cal <- measure_calibration_fit(data, response ~ nominal_conc)
autoplot(cal)

autoplot(cal, type = "residuals")