Let’s use the meats
data from {modeldata} to
demonstrate baseline correction.
library(tidyverse)
library(tidymodels)
library(measure)
tidymodels_prefer()
theme_set(theme_light())
Data Cleanup
Before we can perform baseline correction, we need to reshape the
data. It is in a wide format where the columns represent the wavelength
and the value is transmittance. The step_baseline()
function operates on long format data. We can reshape this data with
tidyr.
meats2 <-
  meats |>
  rowid_to_column(var = "id") |>
  pivot_longer(cols = starts_with("x_"),
               names_to = "channel",
               values_to = "transmittance") |>
  mutate(channel = str_extract(channel, "[:digit:]+") |> as.integer())
meats2 |>
  ggplot(aes(x = channel, y = transmittance, group = id)) +
  geom_line(alpha = 0.5) + theme_light()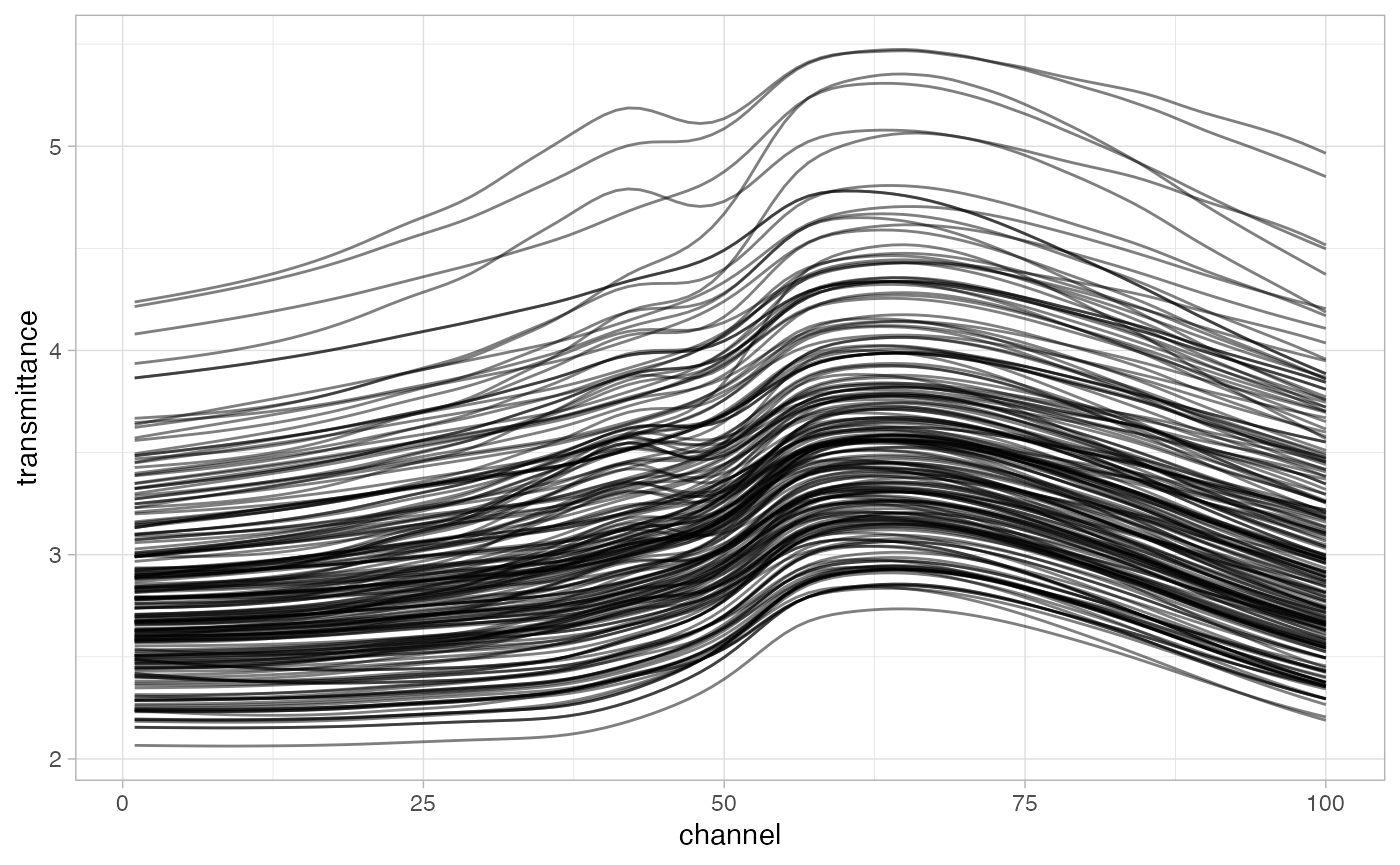
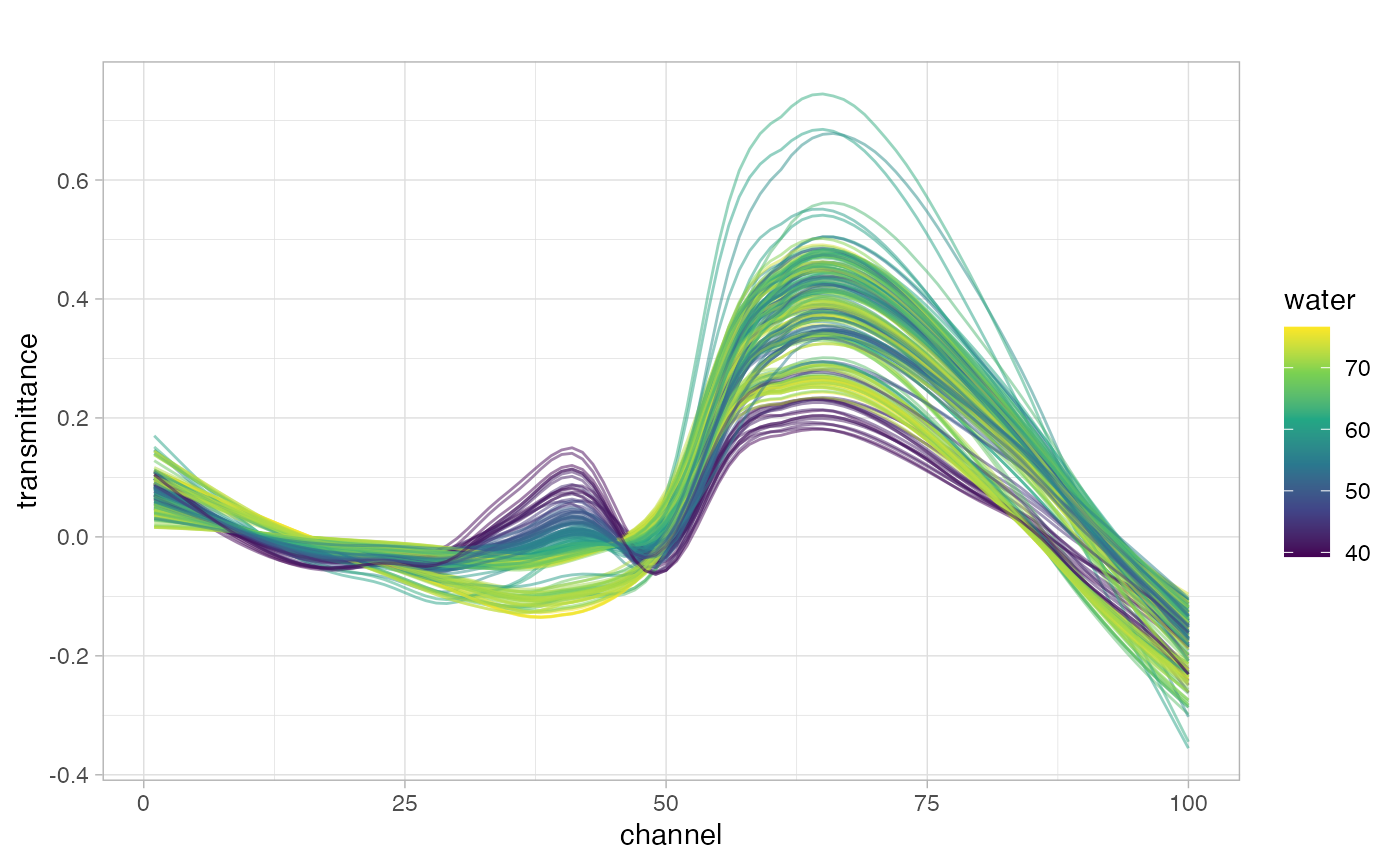
meats2 |>
  group_by(id) |>
  subtract_rf_baseline(yvar = transmittance, span = 0.8) |>
  ggplot(aes(x = channel, color = water, group = id)) +
  geom_line(aes(y = transmittance), alpha = 0.5) +
  scale_color_viridis_c() +
  ggtitle("")